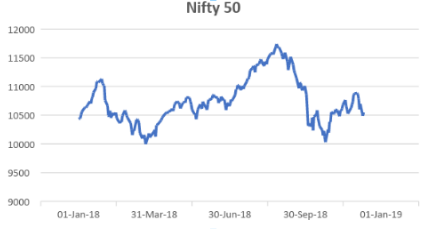
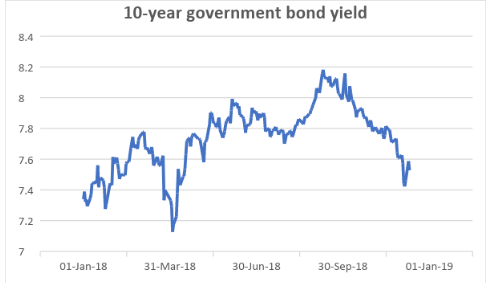
‘So much has happened but nothing has changed’. This will describe the performance of the equity and debt market in 2018. 2018 was a year of much activity in companies and the economy but markets stayed at the same place. The charts below – of the Nifty 50 and the 10-year government paper will tell you that neither equity returns, nor debt returns (from capital appreciation) came by in 2018. But much happened between the beginning of the calendar and now. For starters, the Nifty 50 hit a quick low in March 2018, then went to its 52-week high in August but is now again 10% below its 52-week high. The Nifty Midcap 100 hit a high in January and tumbled, hitting lows in October 2018 and still struggling to recover, with a year to date fall of 20%. Net result? Your large-cap and diversified funds would have delivered flat to negative returns while midcaps would have taken a deeper hit. Debt funds, though, did not do as bad as the 10-year gilt yield, thanks to their reducing maturities and the higher accrual from attractive rates. At the beginning of this year, we anticipated some events to transpire in 2018 and most did. Some events, though, happened earlier than expected and some unexpected events happened too. So, let us take you through the key metrics – what we thought about them beginning 2018 and what transpired. Earnings expanded We said 2018 would be a year that will see earnings finally grow. And it did. The first two quarters of FY-19 saw double digits earnings growth ex-financial services. In September 2018, for 490 of the 500 Nifty 500 companies, sales expanded at a healthy 23% while reported earnings expanded 5% over a year ago. However, adjusting for some exceptional items in large companies such as Grasim and Hindustan Construction Company and Sun Pharma, the sustainable earnings growth was a healthy 19%. June quarter too saw such growth over a year ago. A good number of cyclical sectors including capital goods, iron and steel and construction saw strong growth thus far this fiscal, aided by a low base. Other sectors such as IT, pharma and FMCG also saw steady growth. But despite the broad-based growth, markets rewarded only select sectors such as IT and FMCG. This prevented valuations in other sectors from reaching frothy levels. Expansion in earnings, without price rally meant modest valuations. Valuations shrunk We also said that equity market valuations were way ahead of earnings in 2017 and the upside would be limited in 2018. The bellwether index remained flat but almost 2 in 3 stocks in the Nifty 500 declined. If you take the bellwether index Nifty, you will see the shrinkage in valuations compared with the beginning of the year. In other words, 2018 has been a year of course correction; bringing valuations closer to earnings growth.
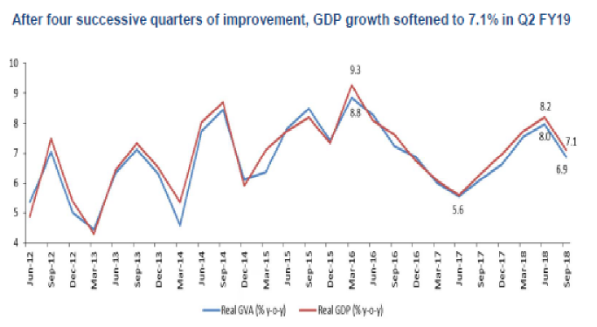
Source: SBI MF. Bloomberg Consensus estimates for Nifty constituents. Mid and small-caps corrected The mid and small-cap segment of the market went into a free fall early part of the year after sustained momentum for 3 years. At the start of 2018, we said the prolonged rally in mid and small caps since 2014 provided an opportunity to shift to large caps. The Nifty Midcap 100 fell 20% year to date (as of Dec.11) while the Nifty Small Cap 100 tumbled 34%. But many midcap funds managed to contain the declines better than their benchmarks, falling 50% lower than their indices. Those who held a more diversified portfolio or contained their midcap exposure would have been less hurt. Macro – trough to peak In 2017, after the June 2017 quarter GDP growth, it was our view that the then concerns on slower GDP growth were overblown and a recovery was underway. It since translated into steady growth. A year later, in 2018, we opined that the June 2018 GDP growth print was not sustainable. The September quarter GDP growth was a more sedate 7.1% over a year ago. We expected lower private consumption, on the back of waning effect of pay commission. Also, the low base effect in manufacturing activity is waning. Very importantly, the uptick in retail credit growth, a major factor for consumption until June 2018, has seen some hiccups on the back of NBFC liquidity issues. Still, high government spending kept the growth ticking compared with a year ago. With a higher fiscal deficit, the ability to spend though stands muted for the rest of the fiscal, despite an upcoming election year. Debt – Crude surprises While we were on track when it came to guesstimating equity market behaviour and the economy, the debt market threw our outlook a bit out of kink, thanks to the sharp rise in crude oil and the rupee and liquidity issues in NBFC debt, later in the year. In a first since January 2014, the RBI hiked repo rate in June 2018 by 25 basis points and followed it up with another hike in August. It cited inflationary risks, primarily stemming from rising commodity prices. While we knew a rate fall regime was over, we had anticipated a no change stance for at least few quarters. The rate hike though happened earlier than anticipated. But that was not the primary cause for the yield up-move as the debt market was already prepared for an RBI rate hike. The sharpening of yields on the back of a tightening liquidity situation in the NBFC space since August 2018 was a prime reason. Besides, defaults/downgrades by a large lending institution led to the 10-year yields hitting 8% in August and again in October. But the initial cause – crude and inflation – turned out to be the remedy. A sharp fall in crude price, easing consumer price inflation and easing liquidity has led to yields settling to 7.5% levels now. So, while debt funds looked terrible a few months ago, most of them are on a recovery route; also aided by higher coupon (interest income) on many of their corporate bonds. Crossing the election bridge If these were issues backed by fundamentals, the uncertainty arising from politics can be cleared – by election results alone. And the heat has just began in the form of the ruling government’s defeat in recent state elections. 2018 was a year of earnings catching up, market correcting itself to healthier levels for specific stocks, economic growth settling down into a steadier pace and debt market shaken after shocks in the form of crude and liquidity. It is also a year where you could only sow. If you had pulled away, there will be nothing to look forward to. If you are staying, will you reap the benefit in 2019? Stay tuned for our outlook in January 2019. But meanwhile, ride on the election fever by capitalising on the volatile opportunities it presents in the market. FundsIndia’s Research team has, to the best of its ability, taken into account various factors – both quantitative measures and qualitative assessments, in an unbiased manner, while choosing the fund(s) mentioned above. However, they carry unknown risks and uncertainties linked to broad markets, as well as analysts’ expectations about future events. They should not, therefore, be the sole basis for investment decisions. To know how to read our weekly fund reviews, please click here.
P/E based on FY-19 earnings estimates*
Jan -18
Nov-18
Nifty
19.3
16.1
Consumer discretionary 22.4 16.0
Consumer staples 38.4
31.4
Energy 13.9
11.4
Financials 23.6
18.6
Healthcare 32.3
22.1
Industrials 25.1
20.7
IT 16.4
17.4
Materials 13.1
11.6
Telecom 81.3
44.6
Utilities 12.2
9.5
2018 – A summary


[fbcomments]


Back to Basics

