
Gold has witnessed a sharp rally over the last 6 years (2019-2025), gaining ~23% annually and multiplying 4x!
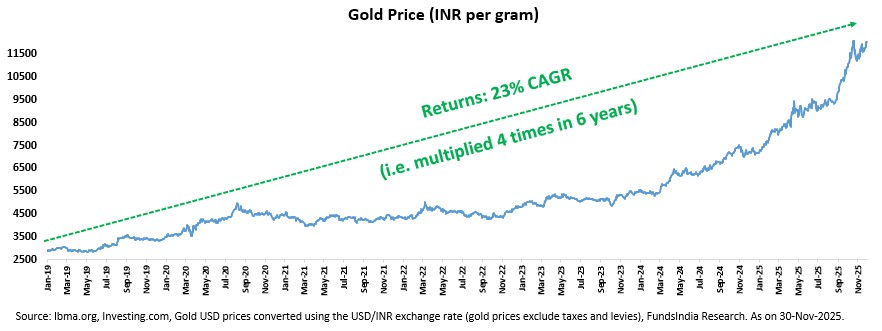
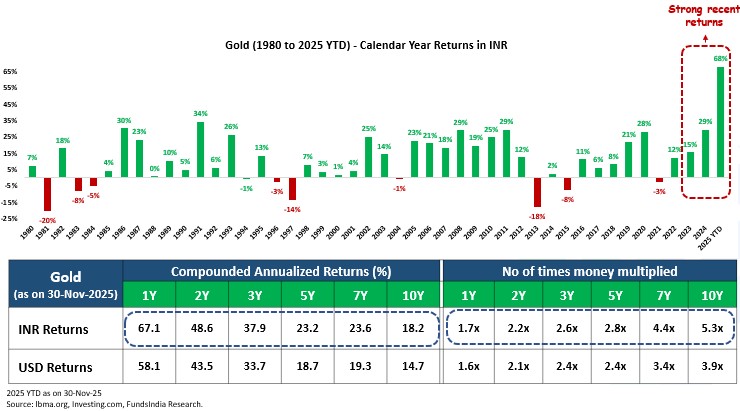
In just the last one year, gold has gained ~67% (as of Nov-25).
But here’s the catch!
Despite Gold’s recent stellar performance, history reminds us that gold is a cyclical asset. Periods of rapid gains were often followed by long, flat stretches.

Trying to guess what gold will do next based on recent performance is tempting. But it’s also unhelpful.
A more useful question is:
- Where are we in the cycle?
- And more importantly: What should a sensible investor do about it?
The goal is not to get the timing perfect. It never is. The goal is to stay thoughtful, balanced, and anchored to first principles. We have previously outlined our view on gold (on Aug-25) here. In this blog, we have refined and updated our framework to reflect the current market environment and reassess where gold stands today.
Introducing our “Golden C-I-R-C-L-E” Framework…
We break this down using 6 key factors to evaluate Gold at any point in time.
- C- Central Banks Demand
- I – Inflation (US CPI)
- R – Real Yields (US)
- C – Cost of Mining
- L – Liquidity (US M2 Money Supply)
- E – Equity Comparison
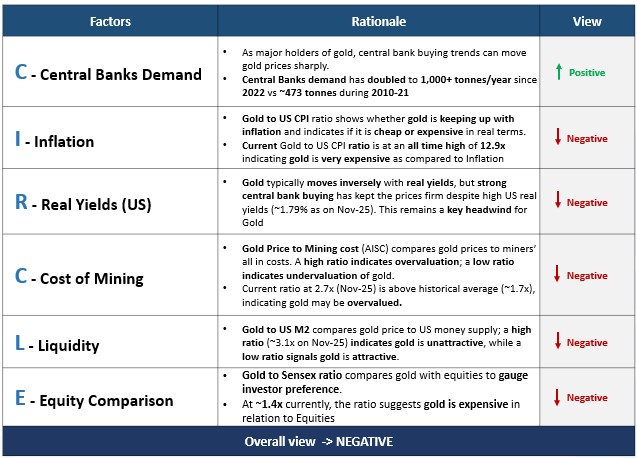
1. C- Central Banks Demand
Central banks hold a major chunk of the world’s gold, giving them a strong influence on gold prices. Even small changes in their buying or selling can move gold prices sharply.
- Developed market central banks hold ~75-80% of their reserves in gold
- Emerging markets central banks hold just 5-15%.
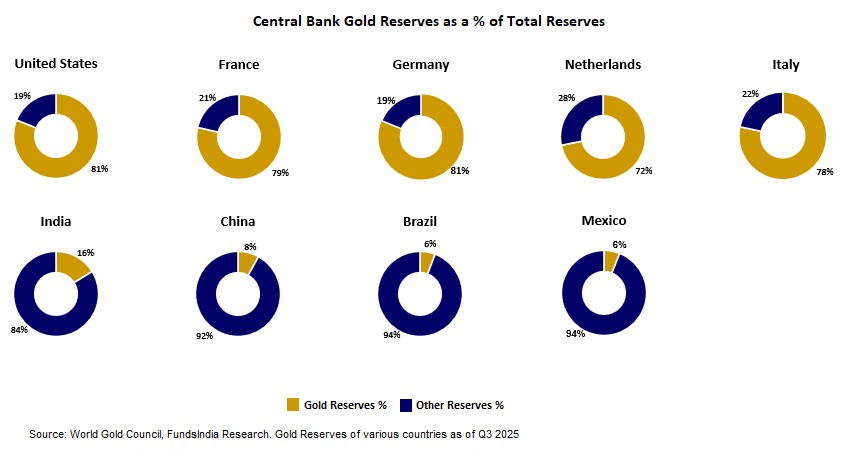
But the tide is turning!
Emerging economies are steadily increasing their gold reserves to diversify and reduce reliance on the US dollar.
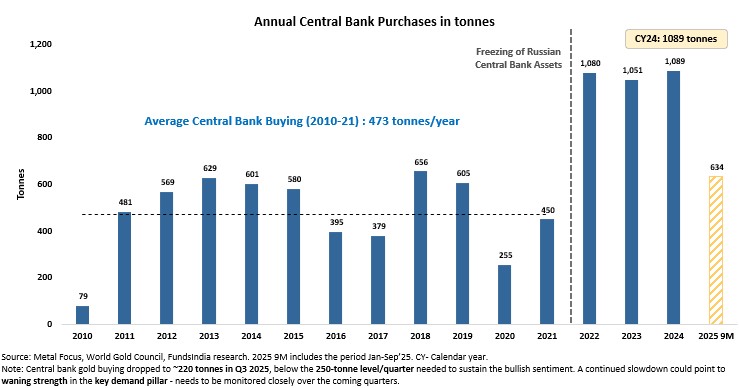
For eg – From 2010-2021, Central banks bought ~473 tonnes of gold annually (~10-11% of global gold demand).
Since 2022, this annual demand has doubled to 1,000+ tonnes (~23% of global gold demand), led by freezing of Russia’s currency reserves by the Western nations -> a wake-up call for countries to shift towards gold.
Given this backdrop, emerging market central banks are expected to continue increasing their gold holdings, from 5-15% to around 20% of total reserves in the coming years.
That said, the central bank gold purchases have started to moderate. Quarterly buying has fallen below the ~250-tonne run rate required to sustain annual purchases of 1,000 tonnes. As of the third quarter of 2025, cumulative central bank buying stands at ~634 tonnes -> ~116 tonnes short of the pace needed to reach 750 tonnes by this point in the year. This is an important trend to monitor, as any further slowdown in central bank demand could weigh down the gold prices.
We believe the current central bank buying trend remains strong and structurally supportive for gold. However, any further moderation in the upcoming quarters will need close monitoring.
Verdict – POSITIVE for Gold.
2. I- Inflation
We compare Gold to US CPI (Consumer Price Index) because CPI measures inflation, and gold is viewed as an inflation hedge.
When inflation rises, the purchasing power of currency falls. Gold, being a real asset with limited supply, tends to hold value better than cash. So comparing gold price to CPI helps investors see whether gold is keeping up with inflation. The Gold-to-CPI ratio helps assess whether gold is cheap or expensive in “real” terms.
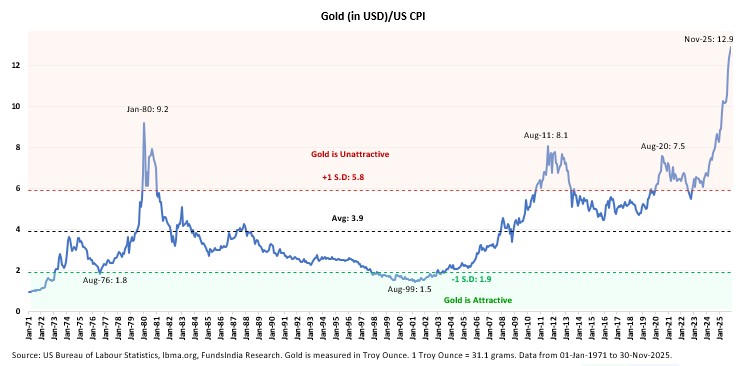
The current Gold to US CPI ratio is at an all time high of 12.9x (vs previous peaks at 7.5x in 2020, 8.1x in 2011 & 9.2x in 1980), indicating gold is extremely overpriced relative to inflation.
Verdict – NEGATIVE for Gold.
3. R – US Real Yields
Historically, gold moves inversely with real yields:
- Yields fall -> gold rises
- Yields rise -> gold falls
This is because global investors typically choose between US 10Y bonds and gold as safe-haven inflation hedge. Increasing bond yields make gold unattractive and vice versa.
However, this relationship has broken down recently led by increased central bank demand offsetting weaker investor inflows.
Gold therefore remains strong despite high real yields (1.79% as on Nov-25).
If not for the central bank buying, the current High US real yield still remains a headwind for gold prices.
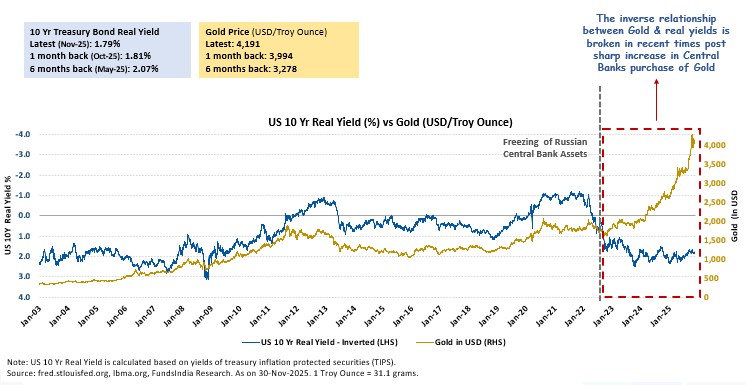
Verdict – NEGATIVE for Gold.
4. C – Cost of Mining
We use the All in sustaining costs (AISC) to assess Mining costs. AISC captures the full cost of producing an ounce of gold. It includes:
- Direct mining costs – labor, energy & materials
- Administration, exploration, and environmental costs
- Sustaining capital – e.g., equipment upkeep and mine development.
Comparing gold price to AISC shows how much profit cushion miners have, and whether gold is overvalued or trading near its cost.
- High Gold Price to AISC Ratio -> Strong miner margins -> Gold may be overpriced
- Low Gold Price to AISC Ratio -> Thin/no margins -> Gold may be undervalued
Currently, the ratio is at 2.7x (Nov-25), above the historical averages of ~1.7x , indicating Gold is overvalued.
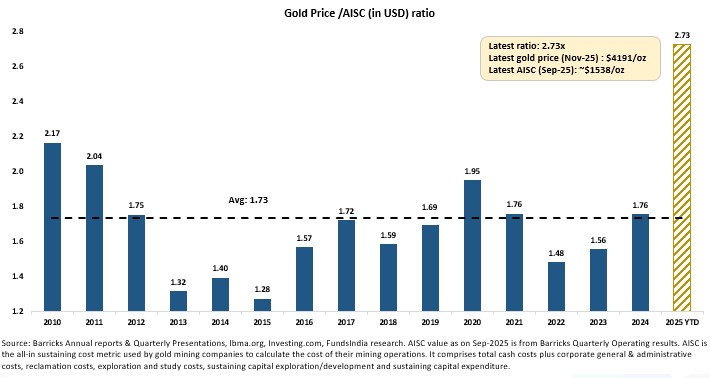
Verdict – NEGATIVE for Gold.
5. L – Liquidity (US M2 Money Supply)
M2 is a broad measure of money supply. It includes currency in circulation, demand deposits, savings, time deposits, and money market funds.
Comparing gold to M2 helps assess whether gold is keeping pace with broader liquidity expansion.
- High Gold to US M2 Ratio -> Gold is expensive
- Low Gold to M2 Ratio -> Gold is cheaper
Currently, the ratio is High at ~3.1x (vs previous peaks at 3.2x in 2011 & 8x in 1980) -> Indicating gold is unattractive vs Liquidity trends.
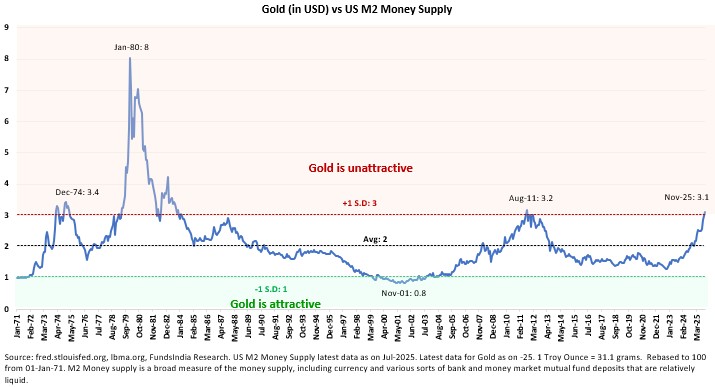
Verdict – NEGATIVE for Gold.
6. E – Equity Comparison – Gold Price to Sensex ratio
The Gold to Sensex ratio helps assess investor’s preference.
- High Gold to Equity Ratio -> Gold is unattractive vs Equities
- Low Gold to Equity Ratio -> Gold is attractive vs Equities
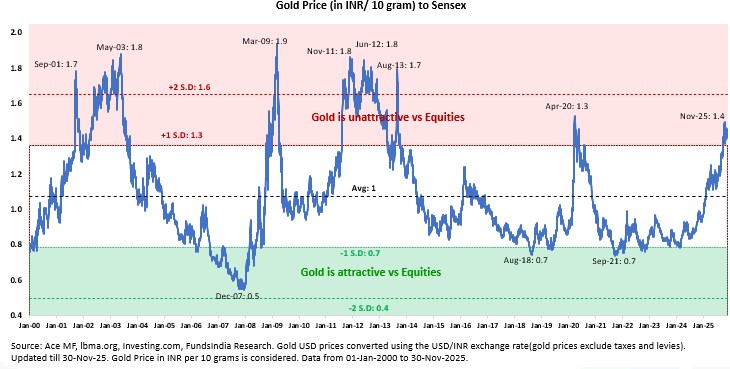
The current Gold to Sensex ratio is at 1.4x, indicating Gold is expensive relative to Equities.
Verdict – NEGATIVE for Gold.
Putting it all together,
Our Overall view on Gold as per Golden C–I-R-C-L-E Framework – NEGATIVE
At a Gold price at ~$4,100/ounce – (1 Positive factor + 5 Negative factors)
Apart from the above 6 factors, gold prices are also influenced by Geopolitical and Economic uncertainties (War, Pandemic, Market crisis etc). These events are beyond our control and are hard to predict.
What should you do now?
- Avoid incremental investments at the current juncture, since 5 out of 6 indicators have turned negative.
- For existing allocation made over the last few years, maintain the long term asset allocation to gold. Cut the exposure if it has increased by 5% from the target.
- Do not go underweight now, since momentum indicators are still strong.


Very well written article. Kindly share your view when these indicators are changing and good time to consider gold again.
Hi Giri, thanks. Sure we will do that.