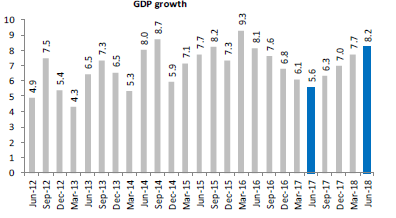
The 8.2% real GDP growth for the June quarter left many analysts and economists surprised. Notwithstanding the low base effect, especially in the manufacturing space, experts acknowledge the numbers as excellent data points. Why is this so? Simply because the growth has been broad based, coming from a revival in manufacturing and construction and surprisingly agriculture too. Besides, from an expenditure side, private consumption has remained robust, contributing 55% to the GDP.
Before we get into whether the growth is sustainable and what is likely to drive the growth, let us look at some of the macro data points to get a better understanding of the GDP growth itself, the positives and concerns.
The data below looks at the drivers of the economy from two angles – one from the industry (and services) side and the other, the retail side.
| Jun-17 | Jun-18 | |
|---|---|---|
| Industry/Services | ||
| Cement production | -3.3% | 13.2% |
| Commercial vehicles sales | 1.4% | 41.7% |
| Petro product consumption (industrial) | -10.6% | 9.3% |
| Core infrastructure | 1.0% | 6.7% |
| Index for industrial production (IIP) | -0.3% | 7.0% |
| Credit growth (Industry) | -1.1% | 0.9% |
| Credit Growth (services) | 4.7% | 23.3% |
| Retail | ||
| Passenger vehicle sales | -10.9% | 37.5% |
| Two-wheeler sales | 4.0% | 22.3% |
| Credit growth (retail) | 14.1% | 17.9% |
| Source: Kotak Report, MOSPI, Office of the Economic Adviser, RBI | ||
Is there a recovery in manufacturing?
If you look at the industry side of the data, the revival in cement production, petro-product consumption by industries, growth in manufacturing (IIP) and core infrastructure all point to increased manufacturing activity. If we break the core infrastructure which feeds into manufacturing (IIP), key elements such as steel, electricity, coal and mining have shown a healthy improvement. For example, steel production increased to 7.3% in June 2018 from 3.4% a year ago. Electricity production grew to 8.5% from 2.1% a year ago and mining to 6.6% from 0.1%. Now, while we can call this a low base effect, the month-on-month growth numbers between these 2 periods talks of a slow gradual increase and not any flashy soar. This essentially means that it is not entirely low base at play. There is an uptick in activity.
The question however is – what is triggering the uptick? Is it increased investment activity or just higher utilization of capacity? The answer lies in credit growth in the industry. The data above will tell you that credit growth is at a measly 0.9% even now. Contrary to belief (a few months ago) that credit growth for companies has already revived, not much has happened in terms of lending activity. This is what experts talk of when they say there is little revival of capex activity in companies. In other words, companies are not borrowing to expand.
So, whatever growth is happening is essentially coming from higher utilization of capacities and in other cases a fallout of consolidation (steel, cement etc.). While this is a good sign, any sustained trigger to GDP growth from this segment can come only on the back of strong capex. Even assuming demand pushes companies to seek borrowing, it may not be that easy given the troubles of banks with bad assets and the stringent norms in assets being categorized as delinquent ones. In other words, massive capex helping GDP growth is not a story that we expect to play out in the medium term.
We also looked at other angles to see if there are green shoots to corporate spending. One other indicator of an uptick in capex activity in companies can be an increase in non-oil, non-gold import. Traditionally, capex spending was accompanied or preceded by increase in capital goods import. However, this time around the non-oil import has other components such as consumption goods such as electronics or at best some commodities, while capital goods import has not seen any evident jump.
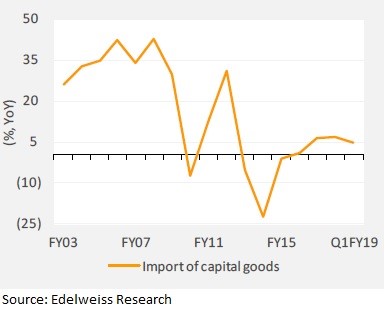
This part of the GDP story, therefore is not an easy one to take off, in our opinion. The story here may lie in better operating efficiencies of companies in the capital goods and engineering space.
Consumption driven
If not manufacturing, where can the growth come from? If the GDP’s private consumption expenditure of 8.6% says anything, it is this: consumption has been the driver of the economy. Unlike the industries that received shocks on various fronts because of demonetization and GST, the consumption space has received a steady boost in the past 2 years. To name a few: One, FY-17 saw a big hike in the Centre’s wage bill on account of the 7th Pay Commission while FY-18 saw state governments implementing it. Two, farm loan waivers have provided steady support to rural consumption. Three, over the past 2 years, thanks to easier financing options and lower rates, whether it was auto or any retail purchases, the credit availability to the retail borrower has significantly increased. Banks’ focus on the less risky retail lending option and closing doors on corporate lending has meant more money in the hands of the consumer.
And the consumption story has been robust despite subdued participation from consumer discretionary, if one looks at the corporate results. A slowdown in real estate could have been a primary reason for this. That means, that a revival in real estate could only further push the spending spree.
And this story may well continue. Why are we saying this? Look at the numbers in the table above again. You will see that the credit growth for the retail space has remained in high double digits, despite a high growth last year too.
That said, can they buttress an 8%-plus GDP growth? That may be difficult since the tailwinds of Pay Commission and farm loan waivers many not repeat themselves. To this extent, the consumption could normalize to healthy levels than the extraordinary levels seen in the past 2 years.
A revival or not?
So, are we saying that there is no real recovery in GDP? Not really. Government spending has been the lone sentinel on the industry spending side but this too has slowed down with government spending at 7.5% in June 2018 versus 17.5% a year ago quarter. On the consumption side, as discussed earlier, with the effect of pay commission or farm loan waiver declining, the rate at which consumption can drive the economy may also come down. In other words, the latest GDP growth print may not be sustainable.
Be that as it may, consumption is likely to remain the larger driver of the economy. Here’s another cue: the RBI’s data suggests that net financial savings (gross savings less financial liabilities) of the household sector as a percentage of gross national disposable income has fallen to 6.7% in 2016-17 (likely to be higher in FY-18 given the higher retail credit) from 8.1% a year ago. This was the lowest in 5 years. Lower financial savings means higher borrowing to spend. And that is where the consumption-driver economy is likely to keep ticking.
For the markets, this is a cue on where the money is to be made. While retail financial services have already been rewarded, there are still a host of other play on this story that will likely be tapped more by mutual funds.
FundsIndia’s Research team has, to the best of its ability, taken into account various factors – both quantitative measures and qualitative assessments, in an unbiased manner, while choosing the fund(s) mentioned above. However, they carry unknown risks and uncertainties linked to broad markets, as well as analysts’ expectations about future events. They should not, therefore, be the sole basis for investment decisions. To know how to read our weekly fund reviews, please click here.