This stock has been one of the out-performers this year. The recent price however suggests that the stock could get into healthy downside correction. The CNX FMCG index too supports the view of a further downside in most FMCG stocks such as Dabur, Marico and Hindustan Unilever along with ITC.
From the daily chart of ITC featured below, it is apparent that the stock has cracked below the prior swing low at Rs.311 which is an early sign that the stock is no longer in an uptrend.
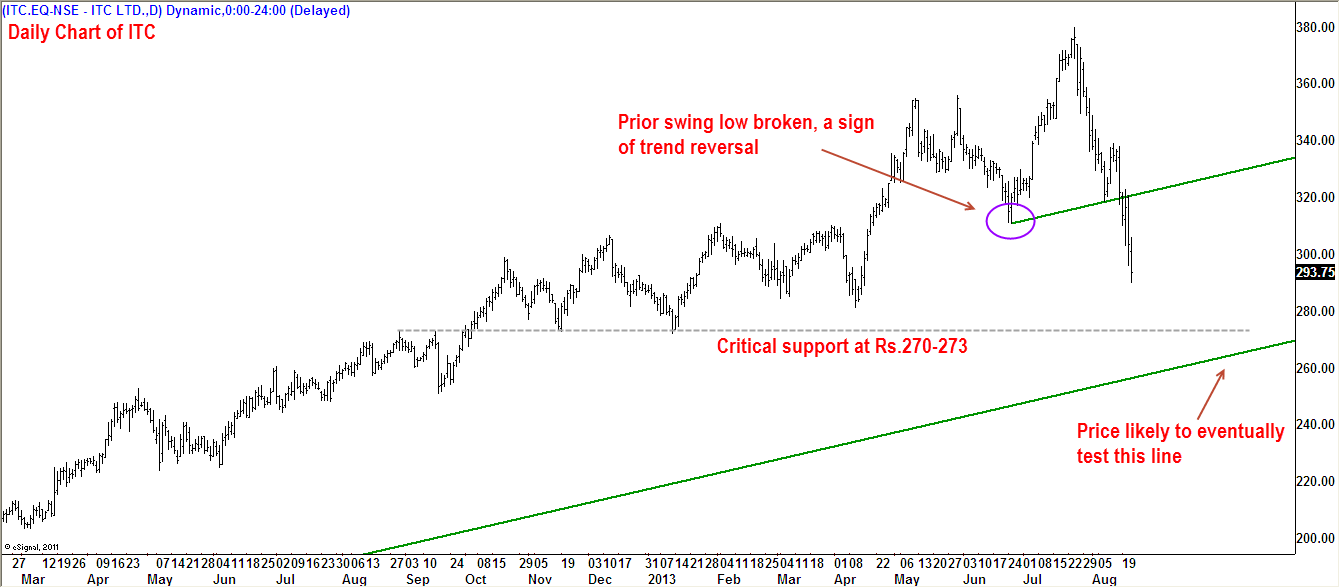
The immediate target we are looking at is Rs.270-273 range. This represents the multi-pivot horizontal support zone highlighted in the chart. We however expect an eventual test of the lower green line a Rs.255-260.
Please realize that the green line has an upward slope and the target would keep inching up with the passage of time. The longer the price takes to reach the lower green line, the higher would be target.
Any recovery in the stock may be used to pare exposures in ITC. The stock has to get past Rs.326 to suggest a reversal of the recent downtrend. For traders, the stop loss for short position has to go above the recent swing high at Rs.339.20.
(The view mentioned here is based on Technical Analysis of historical stock price action. Please read the Disclaimer)