
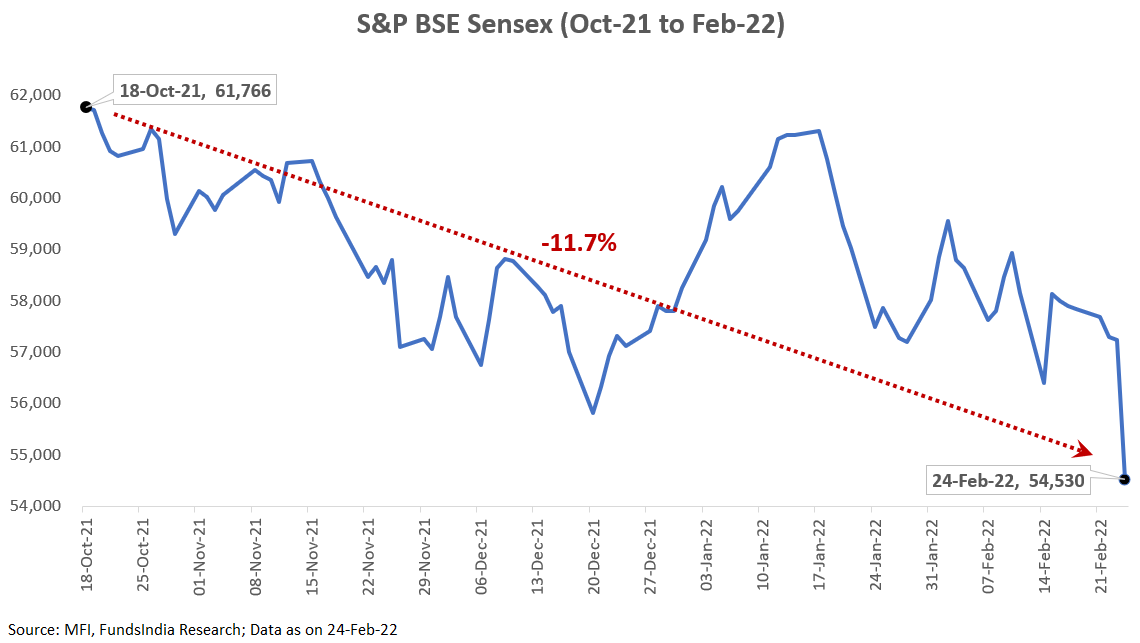
What happened?
Why has the market declined?
Here are some of the factors that have impacted the Indian markets recently
- Russia-Ukraine conflict
- Brent Oil has crossed 100 USD/Barrel – first time in 8 years
- US Fed expected to hike interest rates
- Uncertainty on US Inflation
- Foreign Investors have been selling Indian Stocks for the last few weeks
Now unless you were living under a rock, you pretty well know all these.
But the question that is really bothering you is a simple one…
Is the market decline a small temporary fall or the start of a large market crash?
Why does this question matter?
Because if you know that markets are going to go down, you can exit some/all of your equity exposure and enter back at lower levels.
Why should you unnecessarily put up with the decline in your portfolio?
Fair enough.
But how do you predict the markets?
This is where the problem starts as you need to get two predictions right.
- Prediction on the Event: You need to take a view on what will happen to the different events (Russia-Ukraine Crisis, Oil, Fed Rate Hikes, US Inflation etc)
- Prediction on Market Response: Then you need to predict the exact market response to the events
Both of these are insanely difficult to get right on a consistent basis.
But, if I predict the event, then isn’t the market response simply an outcome of it.
This is where it gets counter-intuitive.
Even if we predict the event right, there is no guarantee we will accurately predict the financial market consequences.
Take the coronavirus pandemic. Assume you had magical powers that let you predict the future except for stock market prices. It’s the 24th March 2020 and a nationwide lockdown has been announced for 21 days. India has 536 confirmed cases and 10 deaths. Sensex is at 26,674. Your magical powers indicate to you that the strict lockdown will last well over 2 months and not just 21 days with very gradual unlocking and the country will have over 97,000 daily cases and 99,000 total deaths by Sep 2020.
Now, equipped with this perfect foresight, what would you have done?
Most people would have predicted an imminent crash in the market and reduced equity allocation.
But what happened?
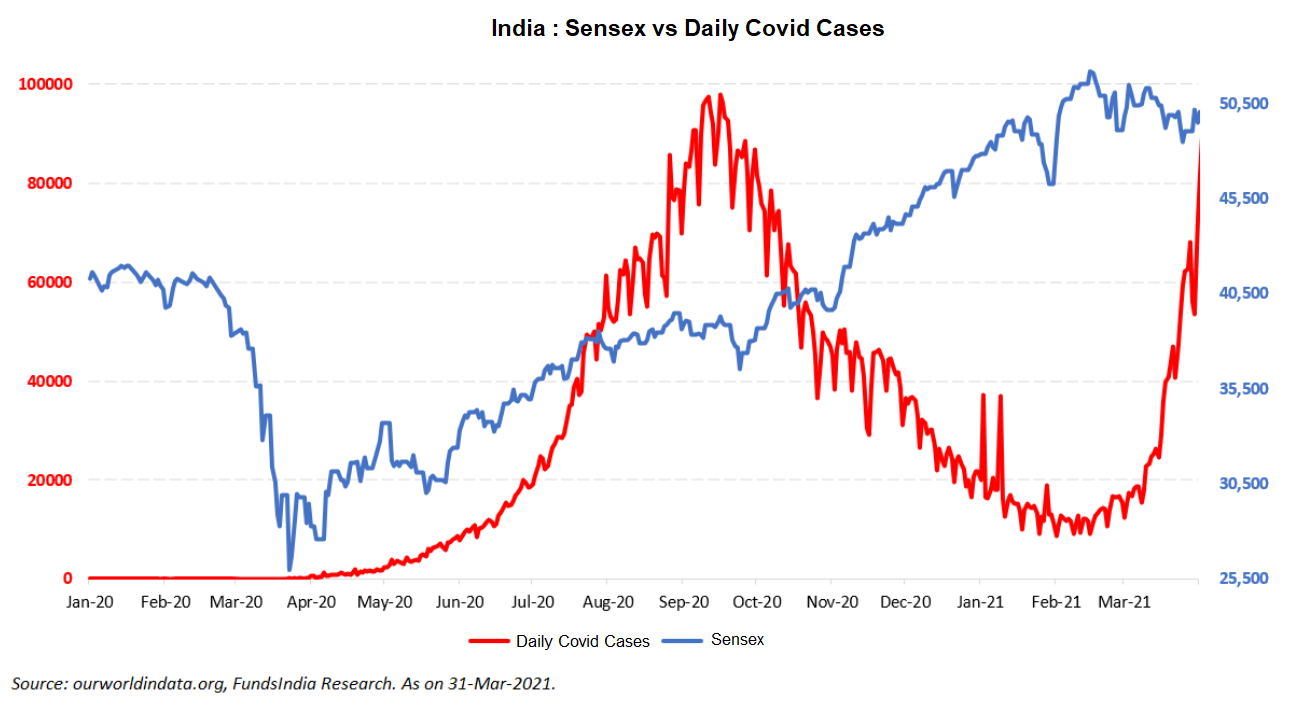
The Sensex went up a cool 101% over the next 1 year.
Sometimes in investing, even foresight may become detrimental!
Our view is simple.
- We cannot predict future events.
Predicting accurately each and every evolving new event which impacts the markets on a consistent basis is extremely difficult. - We don’t know how markets will respond.
If this was difficult, adding to the mix the fact that most of the time, the market may have a completely opposite response to the actual event makes the prediction task almost close to impossible.
Here is a humble reminder of this often forgotten fact
The complication of selling equities now to enter back at lower levels
Now let’s assume, you ignore all the warnings and decide to reduce equity exposure and plan on getting back in at lower levels.
While this seems like an easy decision to make, there are several other future decisions that you will have to make.
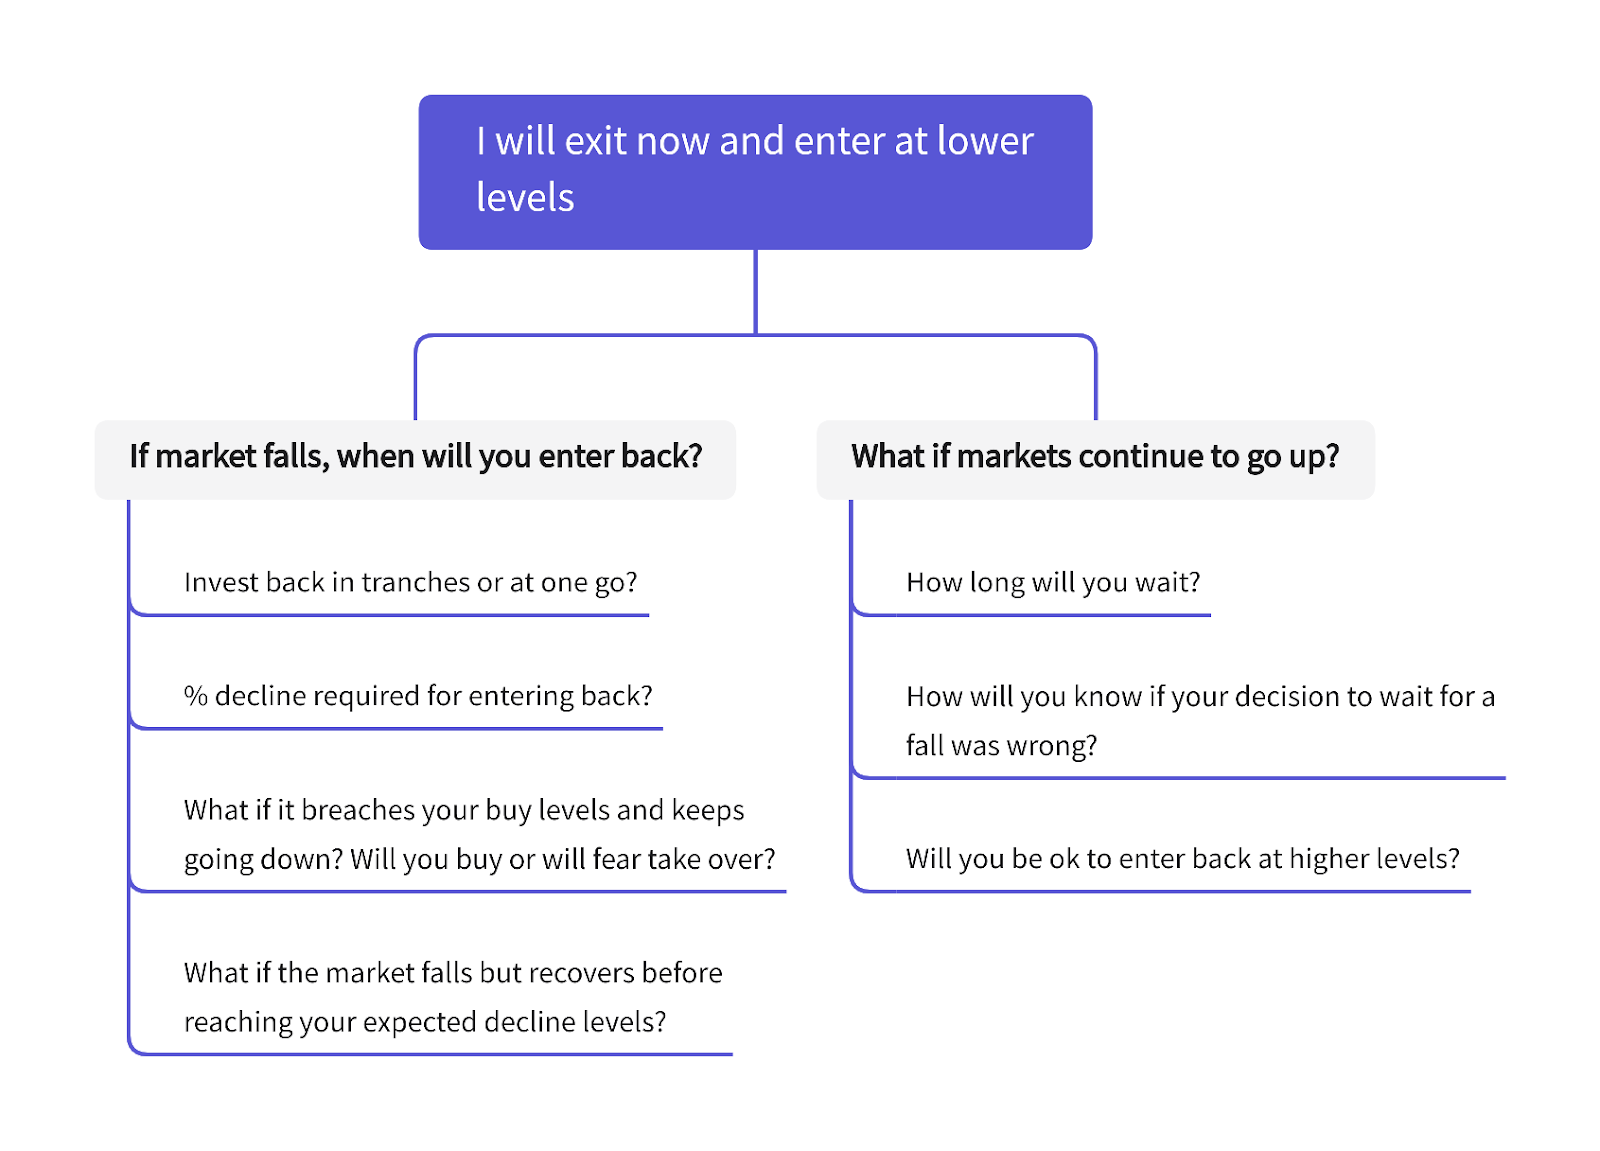
The more you think of these questions in detail and add a “What if….” to the mix, you will suddenly realize that what seems like a simple decision is far more complex than you thought.
So, how do we handle market falls if we don’t know what will happen next?
This is where the timeless framework of “Preparing for Declines” vs “Predicting Declines” comes to your rescue.
Here is how this approach can help you with your decision. (We had applied the same approach in our earlier post when markets had declined on Omicron concerns. You can read the article here)
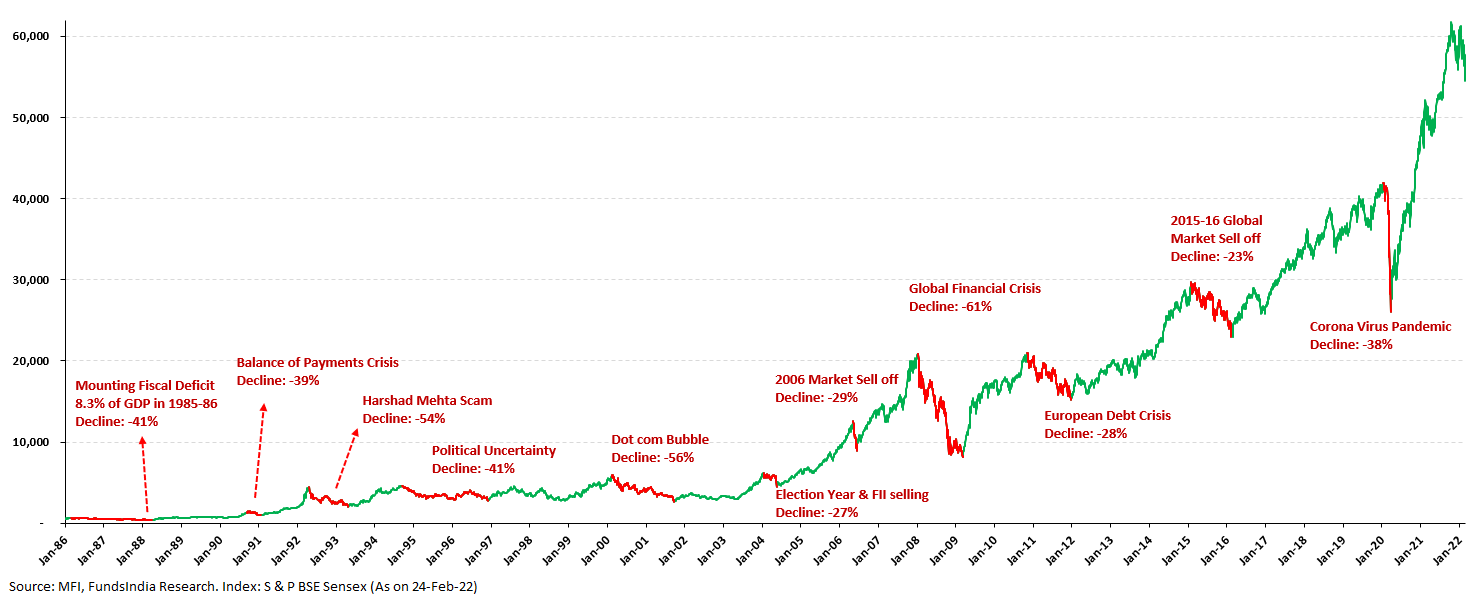
What does history tell us about market declines?
The last 42+ years history of Sensex, has a simple reminder for all of us –
Indian Equity Markets Experience a Temporary Fall EVERY YEAR!
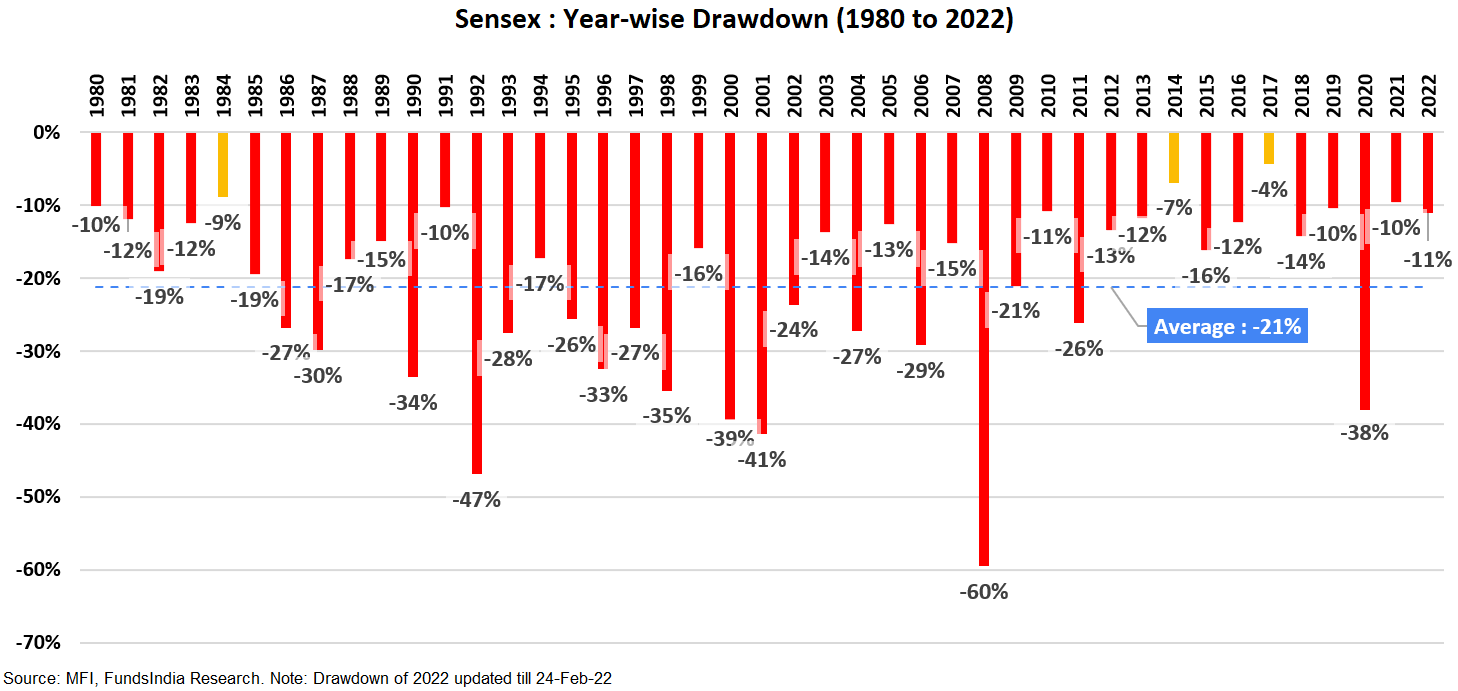
In fact, a 10-20% fall is almost a given every year!
There were only 3 out of 42 years (represented by the yellow bars) where the intra-year fall was less than 10%.
Let us put this in context with the current fall…
It’s ~12% Fall from the peak.
There you go. When viewed from a historical lens, the recent fall is perfectly normal and there is nothing to be surprised about!
But what about the larger temporary falls (>30%)?
Let us again take the help of history to form a view on how common it is for the market to have a temporary fall of more than 30%.
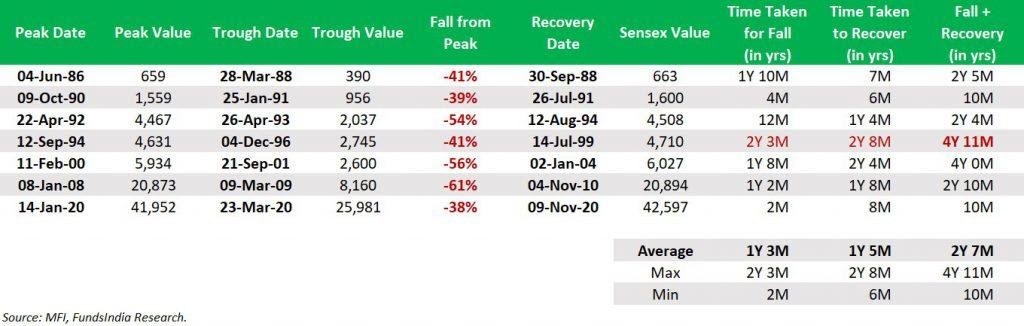
As seen above, a sharp temporary fall of 30-60% is a lot less frequent than the 10-20% fall. They usually occur once every 7-10 years.
Now that leads to the next important question.
Since every large decline will eventually have to start with a small decline, how do we differentiate between a normal 10-20% fall vs the start of a large fall?
The markets have three phases – Bull, Bubble and Bear
When in a Bubble Phase, the odds of a 10-20% correction converting into a large fall is very high.
How do you check for a Market Bubble?
A Bubble as per our framework is usually characterized by
- Very Expensive Valuations (measured by FundsIndia Valuemeter)
- Top of Earnings Cycle
- Euphoric Sentiments (measured via our FINAL Framework – Flows, IPOs, Surge in New Investors, Sharp Acceleration in Price, Leverage)
We evaluate the above using our Three Signal Framework and Bubble Market Indicator (built based on 30+ indicators)
What is our current evaluation?
Here is how our framework evaluates the current markets
1. Valuations are in the Neutral Zone post the correction (earlier in Expensive Zone)
- Our in-house valuation indicator, FI Valuemeter based on MCAP/GDP, Price to Earnings Ratio, Price To Book ratio and Earnings Yield to Bond Yield indicates value of 62 i.e Neutral Zone (as on 24-Feb-2022)
2. Earnings Growth – We are in the Bottom of Earnings Growth Cycle – High Odds of Strong Earnings Growth in the next 3-5 years
- Demand Drivers
- Strong demand for Tech services + Salary Hikes
- Acceleration in Manufacturing – China+1, PLI Scheme, Tax Incentives
- Banks well prepared for the next lending cycle – Worst of NPA cycle behind us + early signs of pick up in credit growth cycle
- Capex Revival led by
- Real Estate Pick up
- Government focus on Infra Spending
- Early Signs of Corporate Capex (Metals, Cement, Renewables etc)
- Global Growth is Supportive
- Lower Interest Rates
- Corporate India Well Positioned to Capture the Demand – led by Consolidation and Strong Balance Sheets
- Consolidation of Market Leaders – Big is getting Bigger!
- Strong Corporate Balance Sheets – Deleveraging over the last decade has cleaned up Balance Sheets
- Several Key Reforms – PLI, GST, Corporate Tax Cut, IBC, Labor Reforms etc
- Favorable Base
- Subdued earnings growth for the last decade – 2011 to 2020 – Early signs of pick up
- Return on Equity below historical average
- Corporate PAT to GDP (2.6% for FY21) is below long term average
- Credit Growth remains below long term average
3. Sentiment: Mixed Signals
- This is a contrarian indicator and we become positive when sentiments are negative and vice versa
- Domestic investor flows have been strong in the last few months whereas 12M FII flows have turned negative due to recent sharp selling (both being very high would have been a concern). 12M FII flows turning negative is a contra positive indicator and has historically led to strong equity returns over the next 2-3 years (as FII flows eventually come back in the subsequent periods). The increase in DII inflows is counteracting volatility in FII flows (due to increasing global yields). Some new NFOs are making record collections.
- IPOs – Sharp correction in some of the recently listed names may help temper sentiments.
- Retail participation in direct stocks – entering euphoric zone with a large number of new investors entering markets in recent times
- Past 3-5Y CAGR is around 14-15% – While on the higher side this is nowhere close to what investors experienced in the 2003-07 bull markets (45%+ CAGR)
- Overall, the sentiments remain mixed and there are no indications of a broad based bubble. However, some excesses are getting built in select pockets.
Overall, our framework suggests that we are not in an extreme bubble-like market scenario.
Putting all this together – Here is the answer for your question
The likelihood of the current fall converting into a large fall (>30%) is very low.
There is always a ‘BUT…’
As mentioned in the beginning, while the odds of a large fall is very low, there is still a small probability that this becomes a large fall.
If we get a large fall, historically we have seen that markets have eventually recovered and continued to grow (mirroring earnings growth over the long term).

This simple insight can be converted into our advantage if we are able to deploy more money into equities from our debt portion at lower market levels during a sharp market fall.
This can be put into action via the ‘CRISIS’ plan. Here is how it works:
Pre-decide a portion of your debt allocation (say Y) to be deployed into equities if in case market corrects
- If Sensex Falls by ~20% (i.e Sensex at 50,000) – Move 20% of Y into equities
- If Sensex Falls by ~30% (i.e Sensex at 44,000) – Move 30% of Y into equities
- If Sensex Falls by ~40% (i.e Sensex at 38,000) – Move 40% of Y into equities
- If Sensex Falls by ~50% (i.e Sensex at 32,000) – Move remaining portion from Y into equities
*This is a rough plan and can be customized based on your own risk profile
OK. Now tell me exactly what to do?
- Maintain original split between Equity and Debt exposure
- Rebalance equity allocation if it deviates by more than 5% of original allocation, i.e. move some money from debt to equity or vice versa and bring it back to original asset allocation split
- If you are waiting to invest new money
- Debt Allocation: Immediately Invest
- Equity Allocation: Invest 40% Immediately and Stagger the remaining 60% via 3 Month Weekly Systematic Transfer Plan (i.e STP)
- If market fall breaches 20% fall…
- Activate the CRISIS Plan!
Summing it up
The simple idea is to accept temporary declines and uncertainty, as an ‘emotional fee’ to be paid for reasonable long term returns. While the short term market moves are not in our control, how we respond and take advantage of any sharp falls is completely under our control.
This is exactly what we attempt to do by preparing and pre-loading our decisions for different market scenarios. This way you are able to live with the typical 10-20% decline tantrums that the market throws at you without panicking.
At the same time, the not-so-frequent large falls that in hindsight turn out to be opportunities can also be taken advantage of in real time using the CRISIS Plan.
Remember that…
Every market decline looks like a great buying opportunity in hindsight, but seems extremely risky when you are in the middle of one!
So, time for the key question – Are YOU going to manage your portfolio or MR PUTIN?


Nice data analysis, concluding with positive sentiment.