In the last few months, Indian equity markets have recovered (up around 14%) and have reached new all-time high levels.
When markets reach all-time highs, it’s normal to feel uneasy and worry that it may fall from the current levels.
Here comes the dilemma…
- What if you decide to reduce your equity exposure but the market goes up further to hit a new all time high?
- What if you don’t reduce your equity exposure and the market falls?
How do we solve this?
Insight 1: All-time highs are a normal and inevitable part of long-term equity investing. Without all-time highs, markets cannot grow and generate returns
For any asset class that is expected to grow over the long run, it is inevitable that there will be several all-time highs during the journey as seen below.
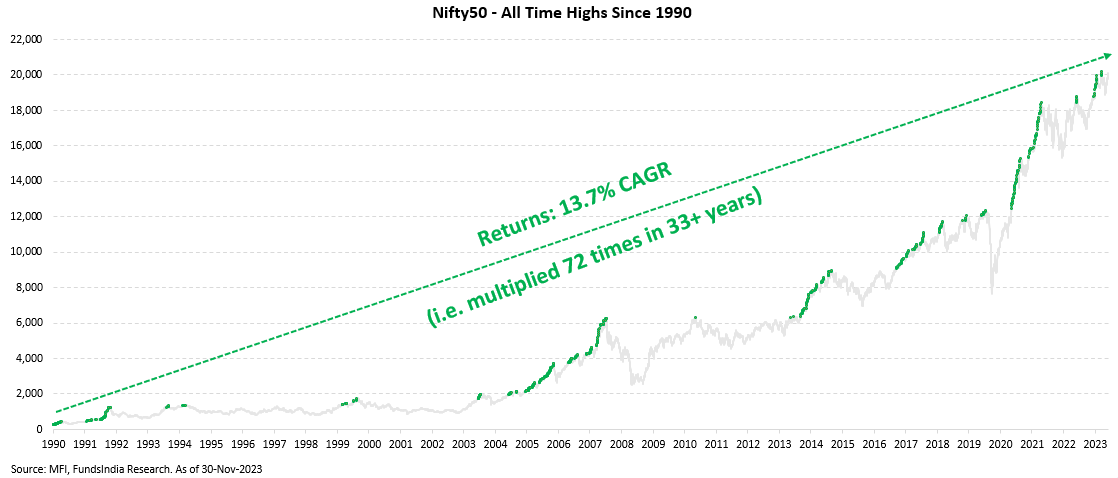
If you expect Indian equities to grow at say 12% per annum (in line with your earnings growth or GDP growth expectation), then mathematically it means the index will roughly double in the next 6 years, become 4X in the next 12 years, and 10X in the next 20 years.
In other words, the index will inevitably have to hit and surpass several all-time highs over time if it has to grow as per your expectation.
So there’s nothing special or frightening about all-time highs.
Insight 2: Equity Markets tend to break out and rally sharply after a few repeated patterns of “all-time highs followed by a fall” to reach higher all-time highs.
There have been frequent phases in the past where the Indian stock market gets stuck in a range for a while and tends to fall every time it hits an all-time high.
During such phases a lot of investors get frustrated and start to assume that every all-time high will lead to a market decline. But that’s not always the case.
Over time, however, after a period of stagnation the market eventually breaks out, surpasses the previous levels, continues to grow, and reaches a new all-time high.
Let us see how this works…
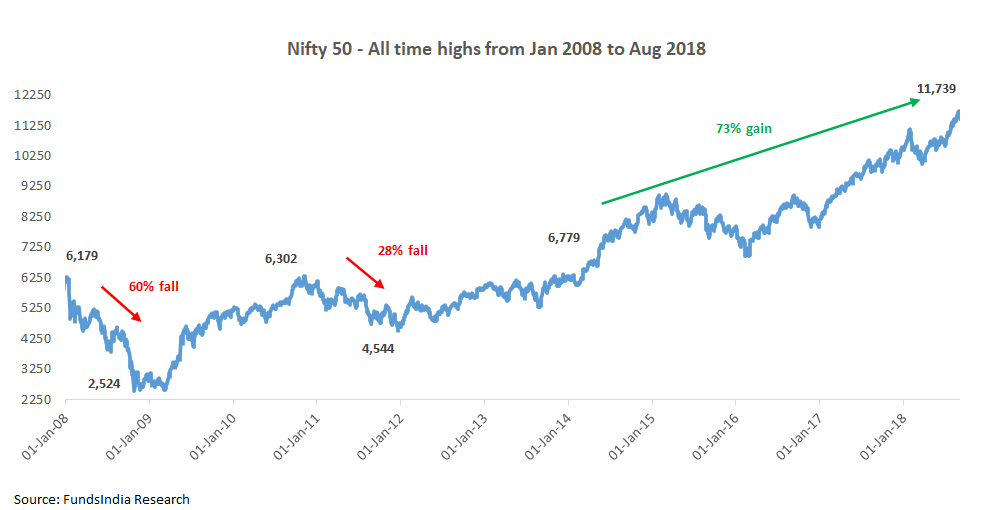
Flashback 1: Between 2008 and 2011, Nifty 50 was stuck at 6,000 levels for some time…
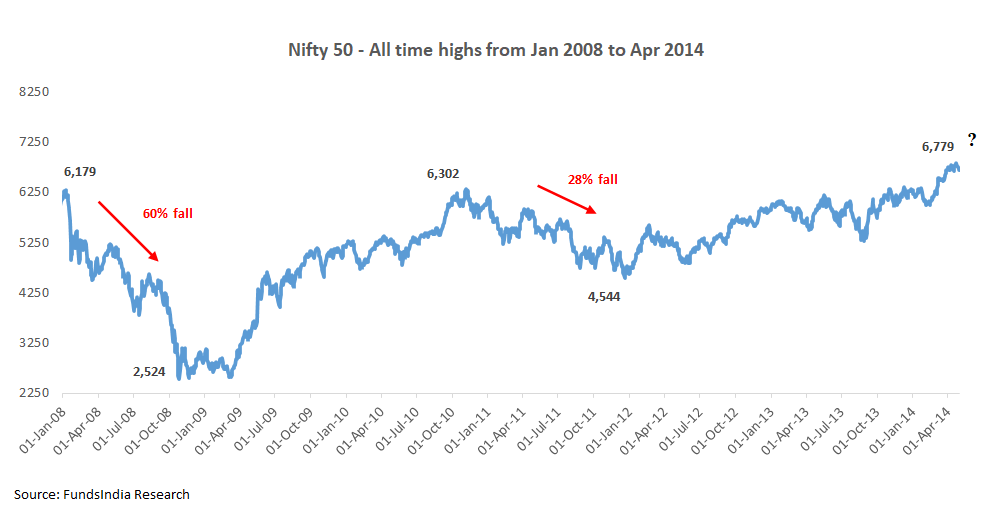
As seen above, the Nifty 50 between 2008 and 2010 hit all-time high levels around 6,000 levels two times in Jan-08 and Nov-10.
In both instances, Nifty 50 fell 60% and 28% after that.
Again in 2014, the market hit all-time high levels, and a lot of investors were already scarred by what happened in the previous two instances and assumed this would lead to another large fall.
… and then came the surprise – Nifty went up by a whopping 73% and went on to hit new all-time highs!
Flashback 2: Between 2018 and 2020, Nifty 50 was stuck at 12,000 levels for some time…
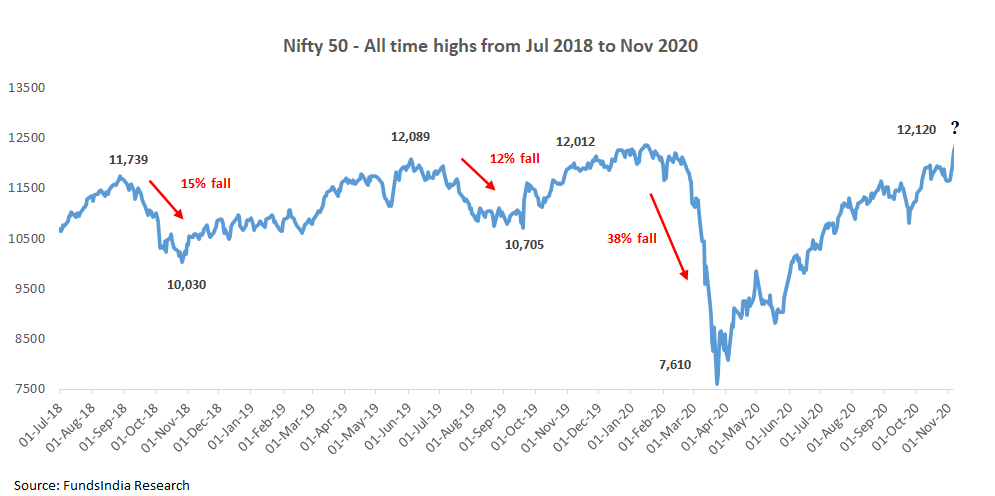
As seen above, the Nifty 50 between 2018 and 2020 hit all-time high levels (around 12,000 levels) three times in Aug-18, Jun-19, and Nov-19. In these instances, Nifty 50 fell 15%, 12% and 38% after that.
Again in Nov-2020, the market hit the same all-time high levels of 12,000, and a lot of investors were already scarred by what happened in the previous three instances and assumed this would lead to another large fall.
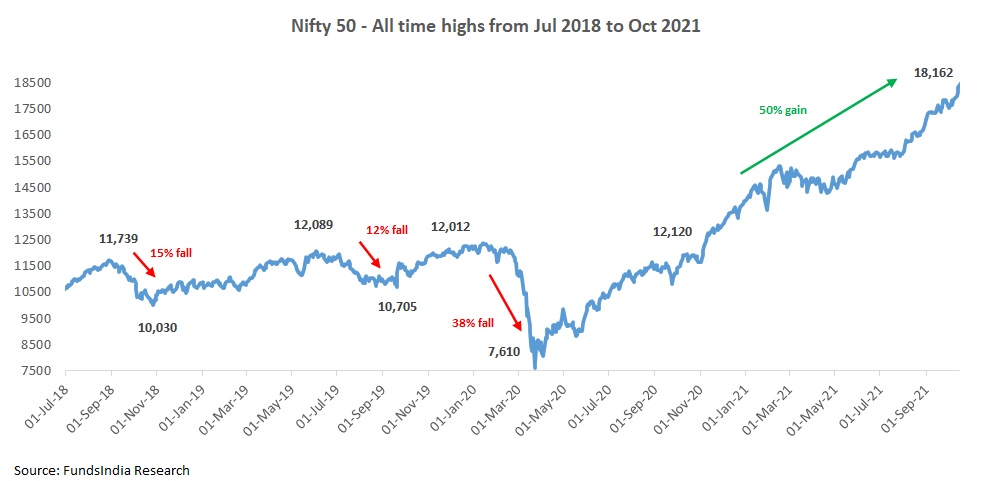
…and then came the surprise – Nifty went up by a whopping 50% and went on to hit new all-time highs!
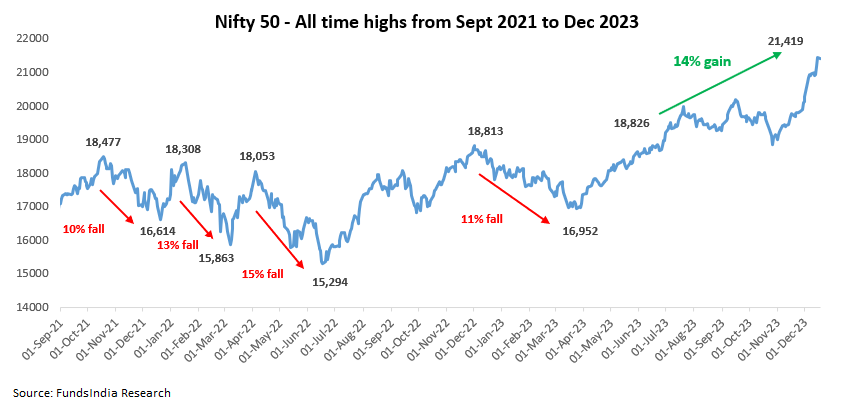
Flashback 3: Between 2021 and 2023, Nifty 50 was stuck at 18,000 levels for some time…
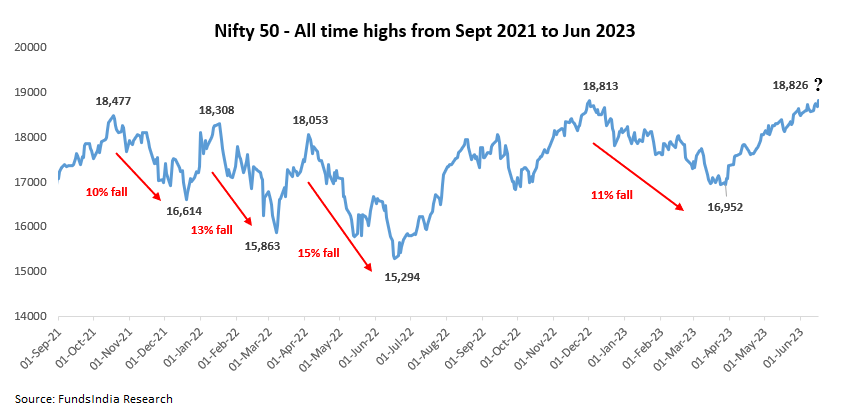
As seen above, the Nifty 50 between 2021 and 2022 hit all-time high levels (around 18,000 levels) four times in Oct-21, Jan-22, Apr-22 and Dec-22. In all these instances, Nifty 50 fell 10% to 15% after that.
In June-2023, the market again hit the same all-time high level, and a lot of investors were already scarred by what happened in the previous instances and assumed this would lead to another large fall. We also wrote a blog and you can read it here.
But here is what happened – Nifty went up 14% to hit a new all-time high!
After the repeated pattern of ‘all-time highs followed by a fall’, we are now seeing early signs of the break out happening (similar to the two flashbacks we read above).
To put this into perspective, as seen in the two flashbacks we saw the pattern break out at 6,000 levels with a whopping 73% gains and at 12,000 levels with 50% gains.
At the current levels we are still only at 14% gains from previous all time highs!
Insight 3: All-time highs have generally been followed by positive 1Y returns
For the last 23+ years, we checked for all the periods where Nifty 50 TRI hit an “all-time high”. We then checked the 1-year, 3-year, and 5-year returns following those “all-time high” levels.
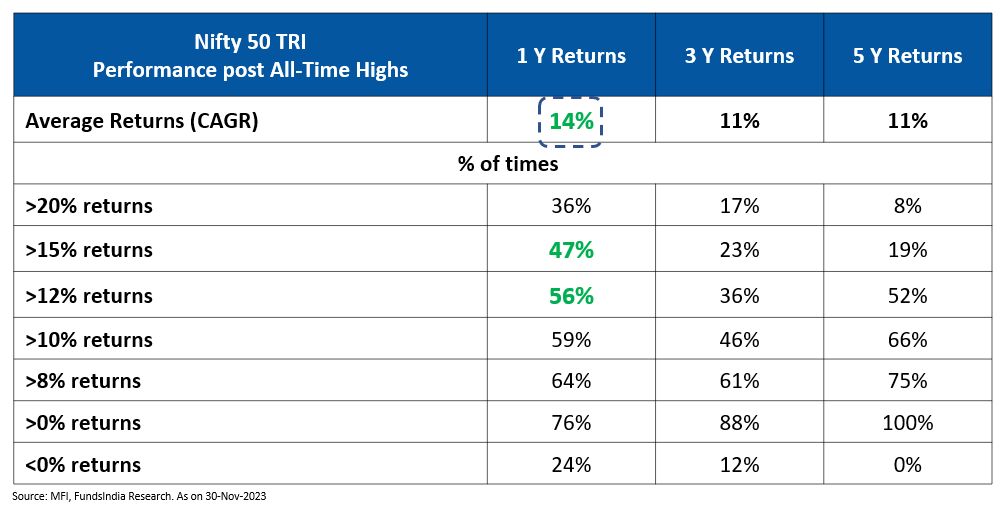
The Nifty 50 TRI gave positive returns 100% of the time on a 5-year basis if we had invested during an all-time high.
The average 1Y returns, when invested in Nifty 50 TRI during an all-time high, is ~14%! (This gets even better for active funds with 20Y+ existence – HDFC Flexi cap fund and Franklin Flexicap fund – the average 1Y returns were much higher at 17% and 19%)
For Nifty 50 TRI,
- 47% of all-time highs were followed by 1-year returns of more than 15%
- 56% of the times – the 1Y returns exceeded 12%
This clearly shows that “all-time highs” automatically don’t imply a market fall and in fact, the majority of times, market returns have been strong post an all-time high.
Putting all this together
All-time highs in isolation do not predict market falls and historically investing at all-time highs has led to good short-term return outcomes the majority of the time!
While there’s no way of knowing what lies ahead in the near term, history shows us that equity markets tend to move higher over the long term in line with earnings growth. New highs are a normal occurrence and don’t necessarily warn of an impending correction. They may in fact signal that further growth lies ahead.
Rather than focusing on “All Time Highs,” what should you pay attention to?
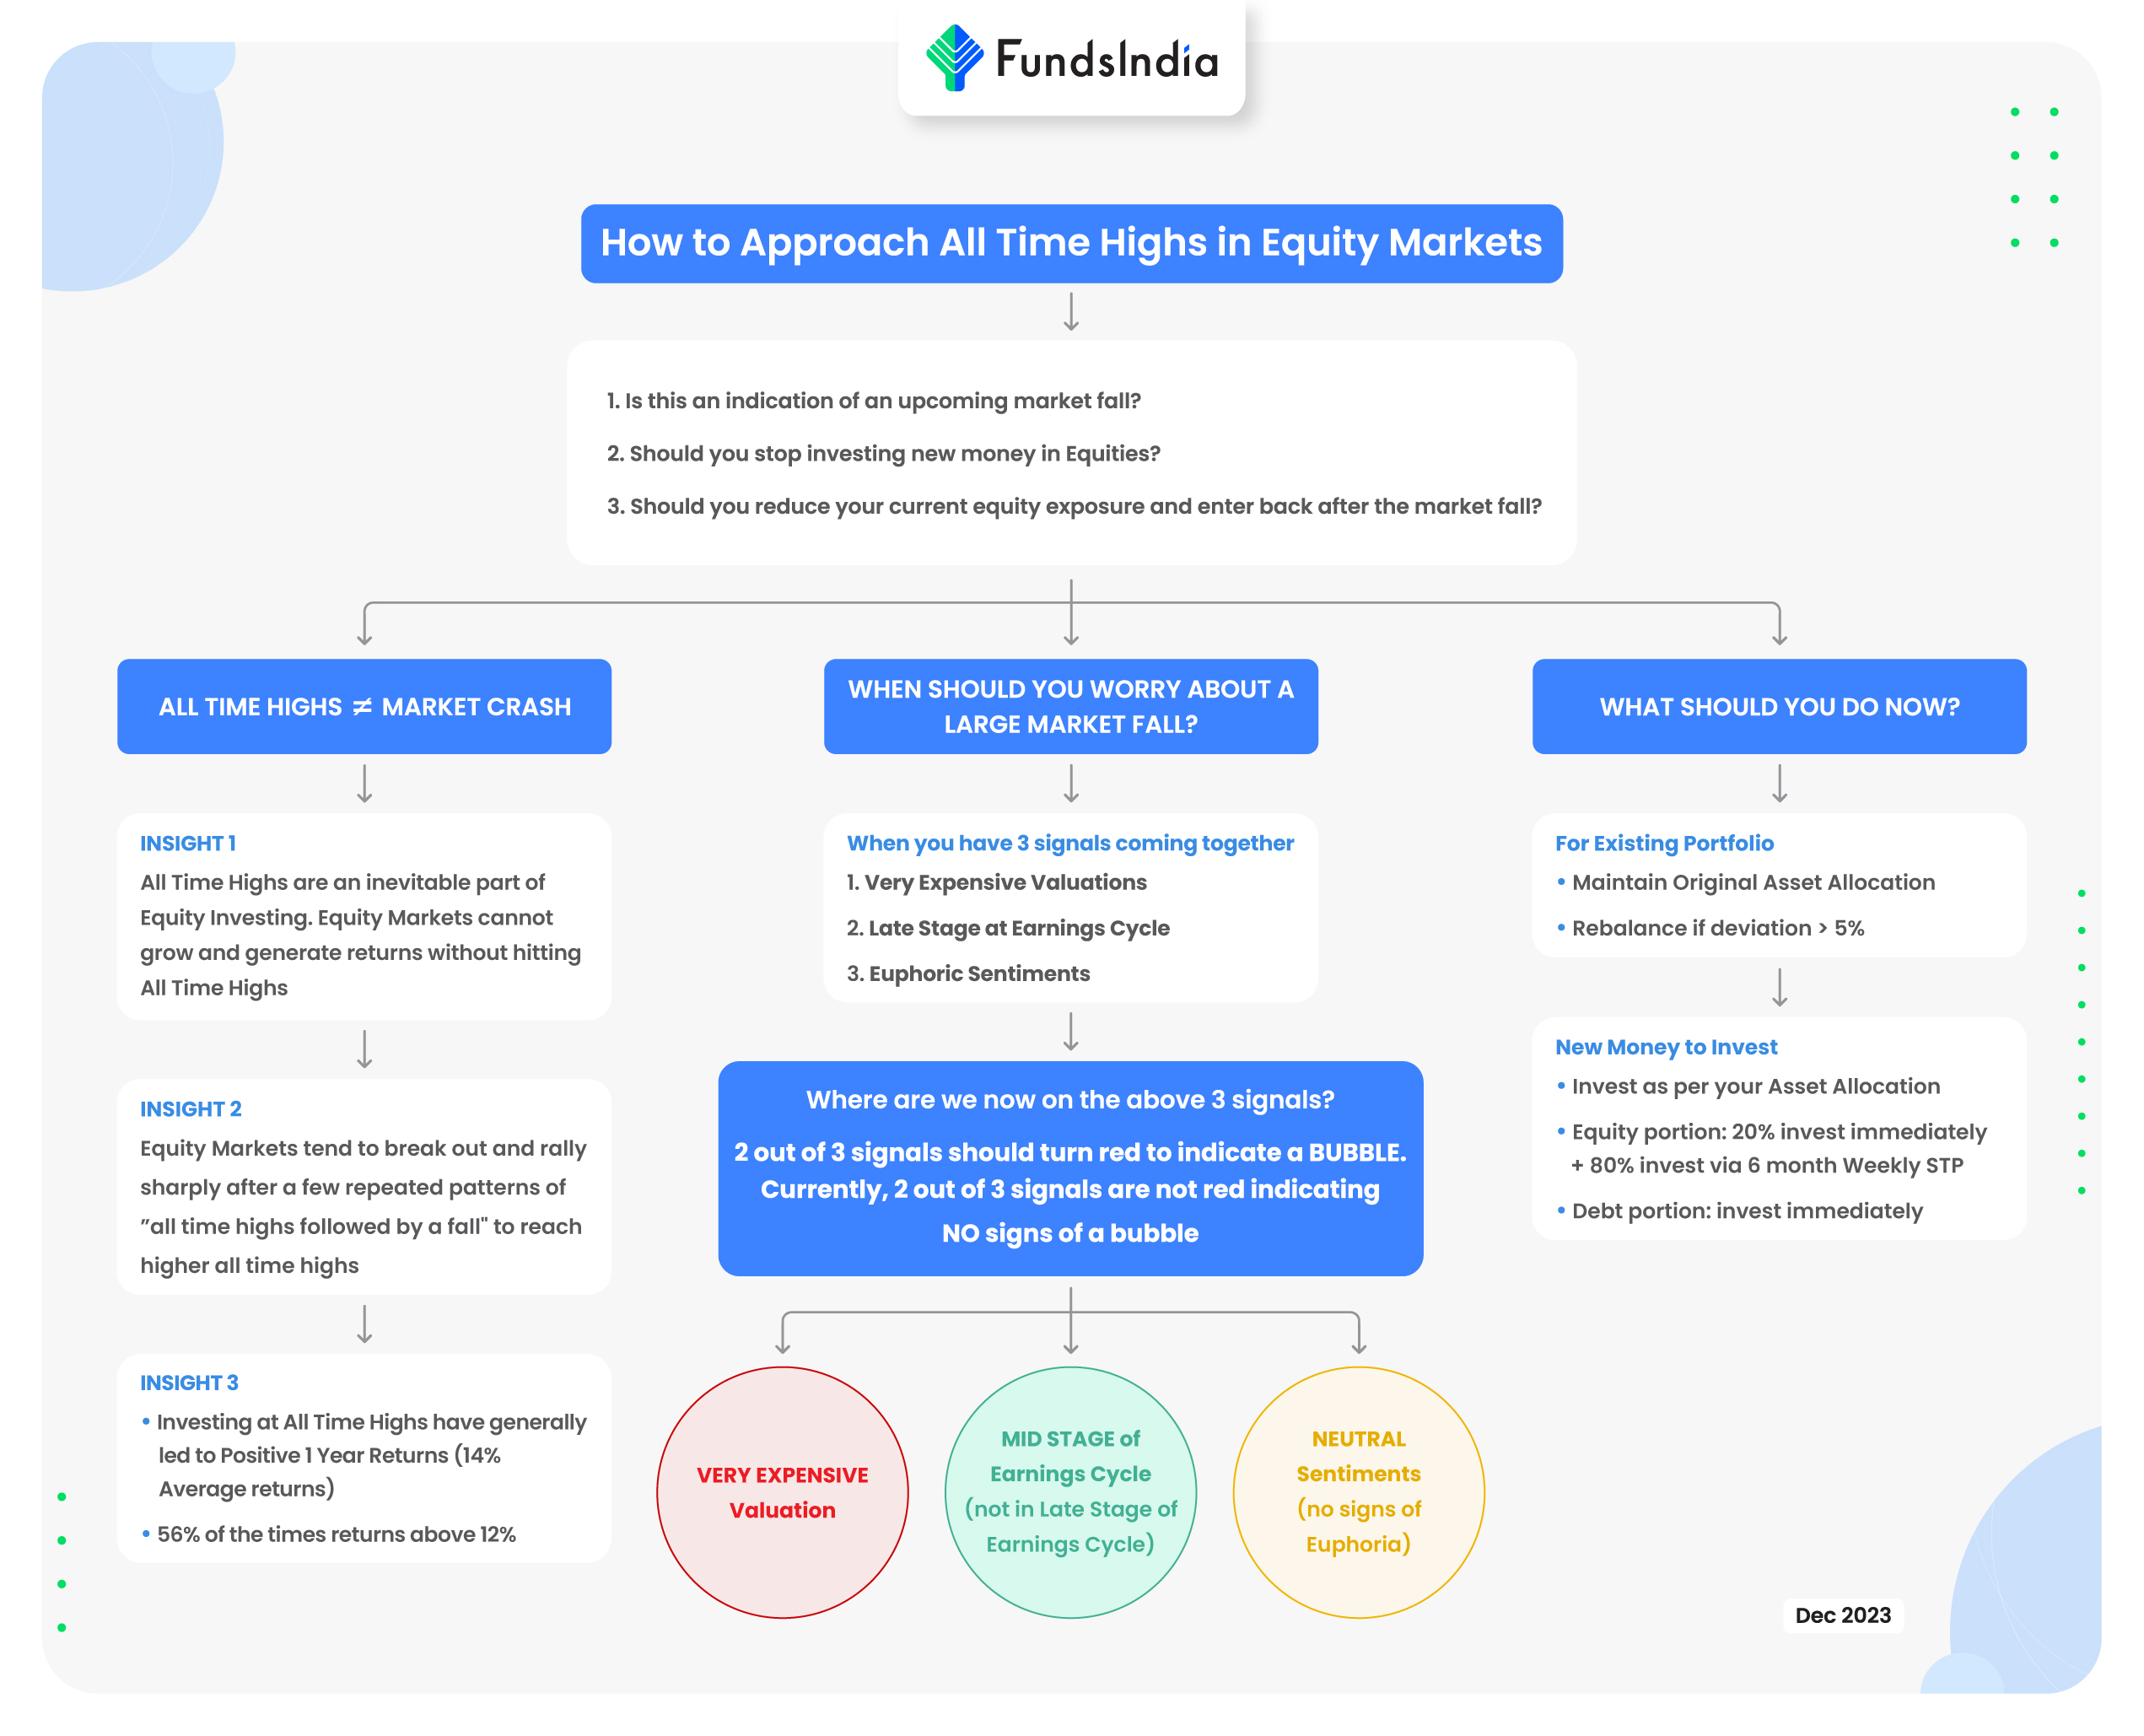
Irrespective of whether the markets are at an all-time high or not, if the following three conditions occur together, then you should worry about a possible bubble (read as high odds of a large market fall) in the markets and re-evaluate your equity exposure.
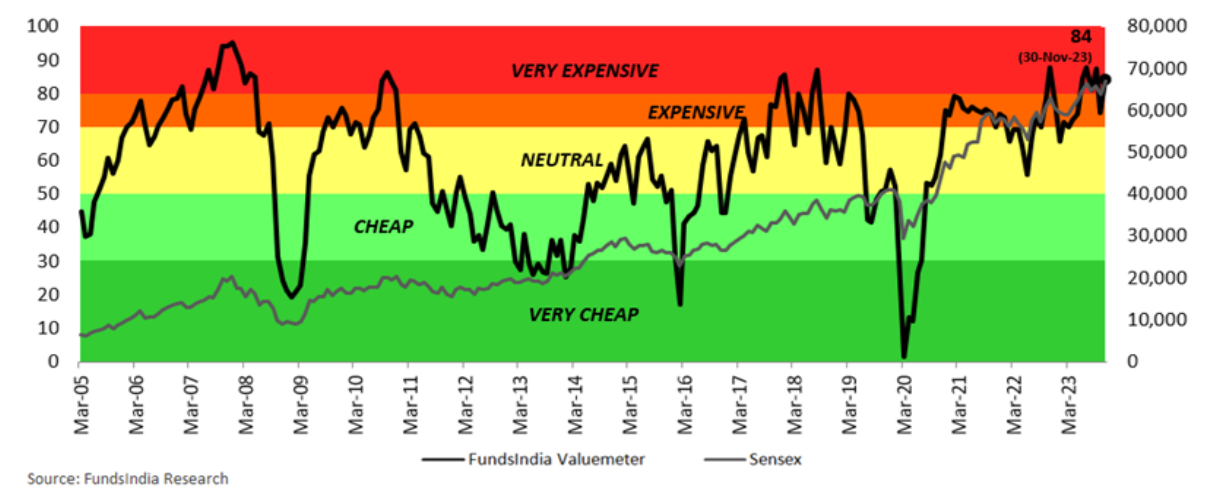
Condition 1: Very Expensive Valuations (tracked via FundsIndia Valuemeter)
Condition 2: Late Phase of the Earnings Cycle
Condition 3: Euphoric Sentiments in the Market
(Strong Inflows from both FII & DIIs, large no of IPOs, high leverage, high new investor participation, very high past returns, new themes collecting large money, etc)
We continuously track the above via our Three Signal Framework and Bubble Zone Indicator (which tracks 30+ indicators).
Evaluating the three above conditions, where do we stand now?
- ‘Very Expensive’ Valuations
- ‘Mid Phase’ of Earnings Cycle (and not ‘late phase’)
- ‘Neutral’ Sentiments (no signs of ‘euphoria’)
Atleast 2 out of the three signals should turn red for our Bubble signal to flash red.
Currently only one signal (valuiation) is in red indicating no usual signs of a bubble. This implies the odds of the current all time high leading to a large temporary market fall (read as 30-60% temporary fall) is low.
If you are interested in the detailed rationale you can read it in the annexure (included in the end of the blog).
So, what should you do now in your portfolio?
- Maintain your original split between Equity and Debt exposure
- If your Original Long Term Asset Allocation split is for eg 70% Equity & 30% Debt, continue with the same (do not increase or reduce equity allocation)
- Rebalance Equity allocation if it deviates by more than 5% from the original allocation, i.e. move some money from equity to debt (or vice versa) and bring it back to the original asset allocation split
- Continue with your existing SIPs
- If you are waiting to invest new money
- Debt Allocation: Invest now
- Equity Allocation: Invest 20% now and stagger the remaining 80% via 6 Months Weekly STP
An overview of how to deal with such all time highs can be found in the flowchart below
Annexure:
You can find a quick rationale for our Equity view base on our Three Signal Framework below:
- Valuation: ‘VERY EXPENSIVE’ Valuations
Our in-house valuation indicator FI Valuemeter based on MCAP/GDP, Price to Earnings Ratio, Price To Book ratio, and Bond Yield to Earnings Yield indicates the value of 84 i.e. Very Expensive Zone (as of 01-Dec-2023).
- Earnings Growth Cycle: MID PHASE of Earnings Cycle – Expect Good Earnings Growth over the next 3-5 years
This expectation is led by Manufacturing Revival, Banks – Improving Asset Quality & pickup in loan growth, Revival in Real Estate, Government’s focus on Infra spending (which continues in FY24), Early signs of Corporate Capex, Structural Demand for Tech services, Structural Domestic Consumption Story, Consolidation of Market Share for Market Leaders, Strong Corporate Balance Sheets (led by Deleveraging) and Govt Reforms (Lower corporate tax, Labour Reforms, PLI) etc.
- Sentiment: ‘NEUTRAL’
This is a contrarian indicator and we become positive when sentiments are pessimistic and vice versa.
DII flows continue to be strong. DII Flows have a structural tailwind in the form of – Savings moving from Physical to Financial assets, Emerging SIP investment culture and EPFO equity investments.
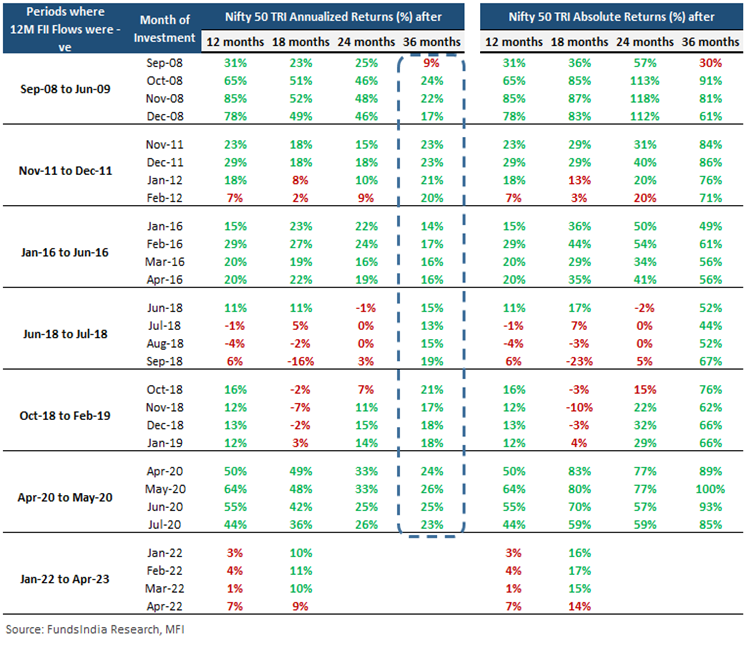
Early Signs of FIIs coming back to Indian Equities after a period of selling. Both FII & DII flows being very high would be a concern. Despite the FII inflows in recent months, between Oct-21 and Jun-22, FIIs took out Rs 2.6 lakh cr from Indian equities and of this only Rs 2 lakh cr has come back – indicates significant scope for higher FII inflows.
Negative FII 12M flows have historically been followed by strong equity returns over the next 2-3 years (as FII flows eventually come back in the subsequent periods). In the table below we can see the Nifty 50 TRI annualised returns for 2-3 years period after every period of FII negative flow.
To read in detail about how we derive our equity view, please refer to our monthly reports – FundsIndia Viewpoint and Bubble Zone Indicator.