The IDFC stock has fallen sharply in the past few weeks after its exclusion from the MSCI India index and the reduction in the FII limit. The recent crack has pushed the stock to an area of support that is highlighted in the weekly chart featured below.
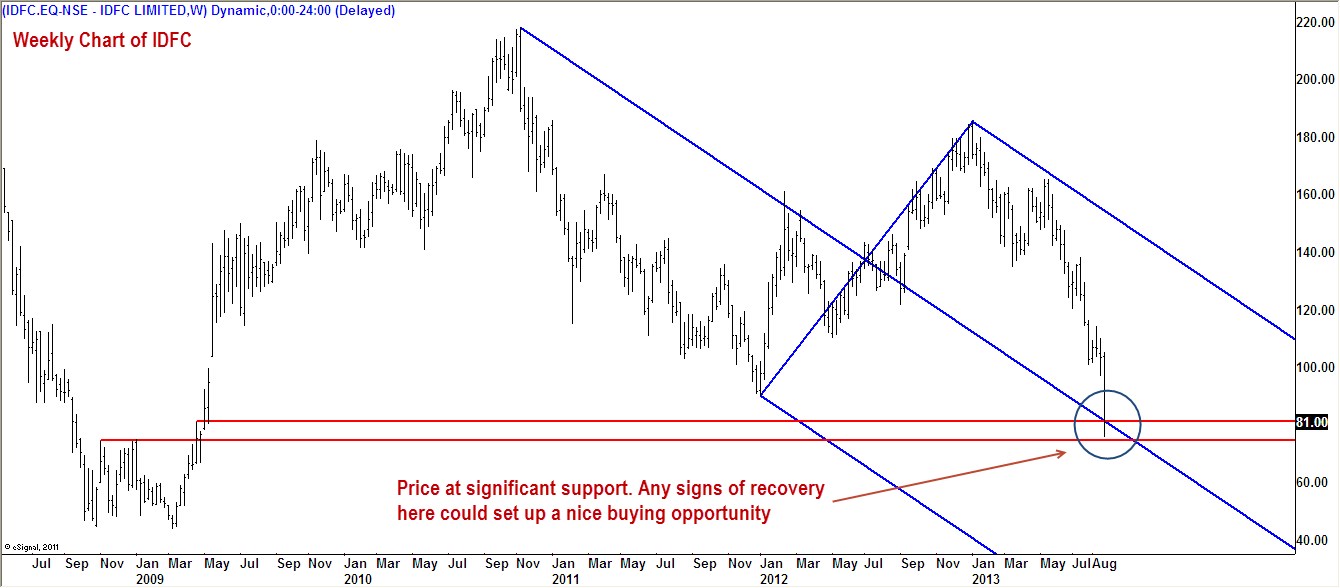
While there are no signs of reversal as yet, it would make sense to keep this stock in the radar. Apart from the middle line of the downward sloping pitchfork, the price is also at the prior gap area and swing high highlighted by the red set of parallel lines in the above chart.
There is a case for this fall to be arrested at these levels. Let’s turn our attention to the daily chart of IDFC displayed below.
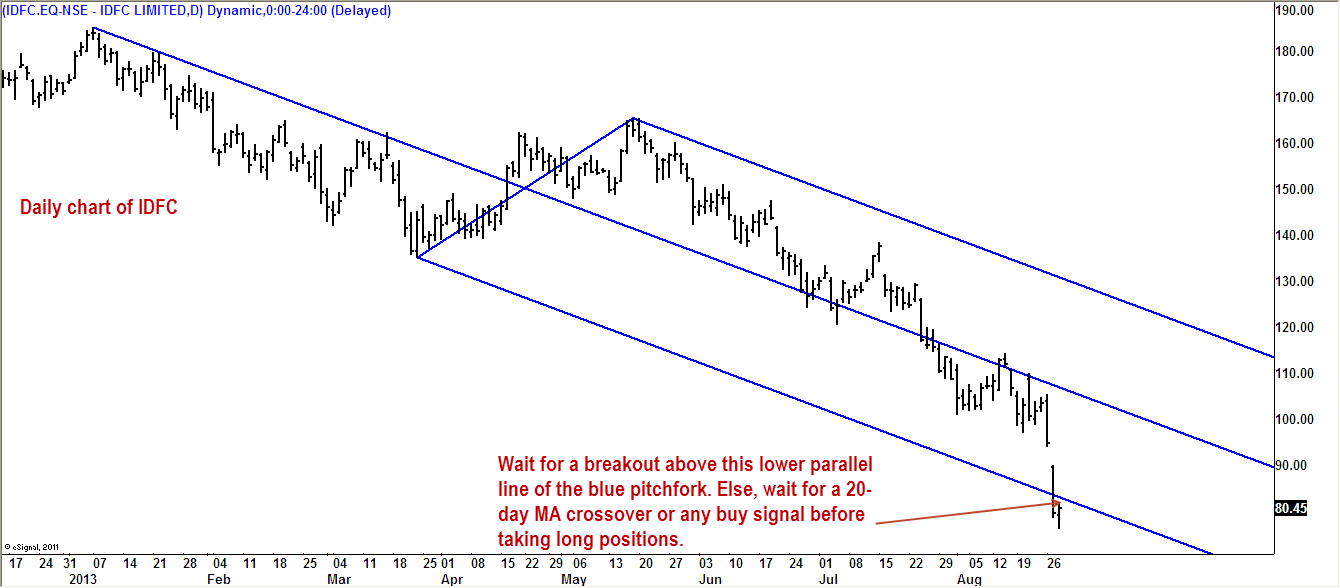
The stock has slipped below the lower parallel of the pitchfork. The August month derivatives contract expires tomorrow. Investors may therefore wait for a few days to see if the price manages to move above the lower parallel of the pitchfork.
Any breakout past this line may be used as a trigger to buy the stock with a stop below the most recent swing low formed before the breakout. Those who believe in indicators may either await a buy signal in MACD or a crossover of the price above the 20-day moving average before investing money.
The idea is to look for emergence of some buying interest before committing funds. If the stock indeed bottoms out at current levels, we would expect a rally to Rs.100 to begin with. Let’s discuss higher targets if the price settles down and triggers a buy signal.
(The view mentioned here is based on Technical Analysis of historical stock price action. Please read the Disclaimer)