Hope you found the previous week’s post on the Relative Strength Index (RSI) interesting. Taking the discussion forward, let’s discuss the typical range within which the RSI moves in a strong trending market. It has been observed that the RSI tends to oscillate between 40 to 80 in an uptrend and 20 to 60 in a downtrend.
Hence, look for buying opportunities in an uptrend when the RSI dips to the 40-50 range; look for shorting opportunities in a downtrend when the RSI reaches the bear market upper boundary of 50-60.
An initial breakout past the 70-mark in the RSI is a sign that the stock is entering into a bullish phase. If the RSI manages to hold above the bullish support zone at 40-50 in the subsequent corrective phase, it strengthens the bullish case scenario and long positions may be initiated thereafter.
Let’s try to integrate this range shift characteristic of RSI along with moving averages to identify potential trade set-ups. Take a look at the weekly chart of ESSDEE Aluminium featured below.
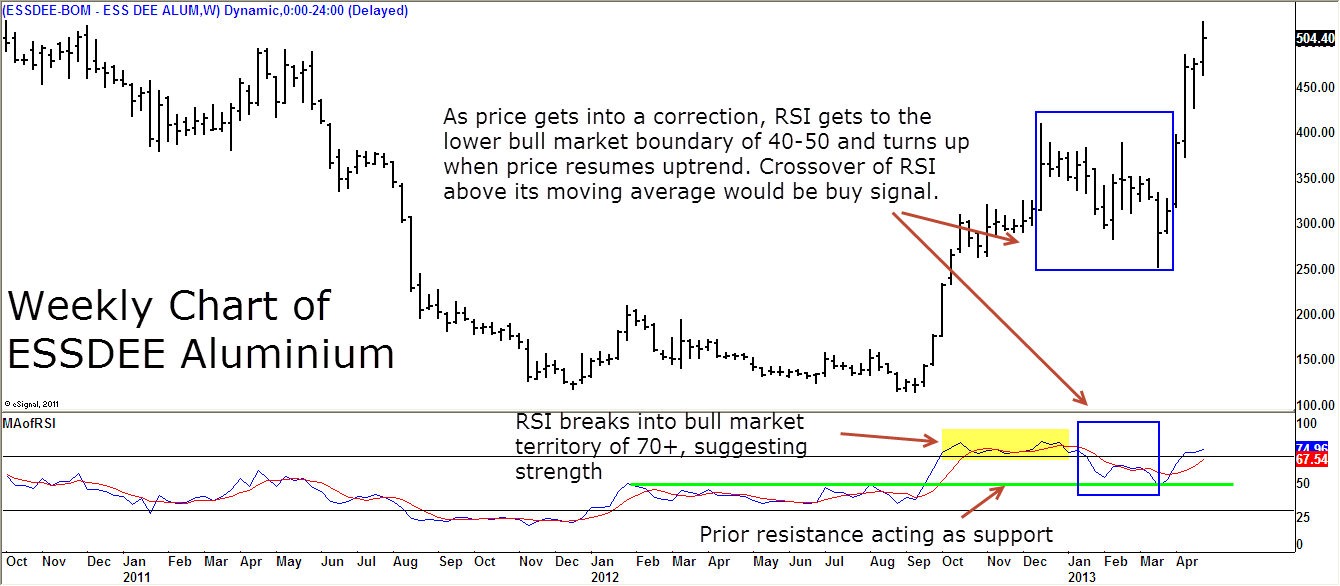
It is apparent from the above chart that ESSDEE Aluminium has been in a strong uptrend for several months now. Notice the correction in price during Dec. 2012 to March 2013. During this correction, the RSI dropped to the lower boundary of 40-50 and turned around, suggesting that the bullish trend is intact.
The blue line in the lower pane represents 14-period RSI and the red line in the same pane is the 10-day simple moving average of the RSI. Notice how the prior resistance (marked by the green line in the RSI window) acted as support during the correction phase. From a trading perspective, we can look for buying opportunities as the stock is in an uptrend.
The crossover of the RSI above its 10-day moving average may be used as a trigger to initiate long positions. As always, remember that we are addressing just one aspect of trading – the ENTRY. Please sort out the STOP-LOSS and TARGET before initiating the trade.
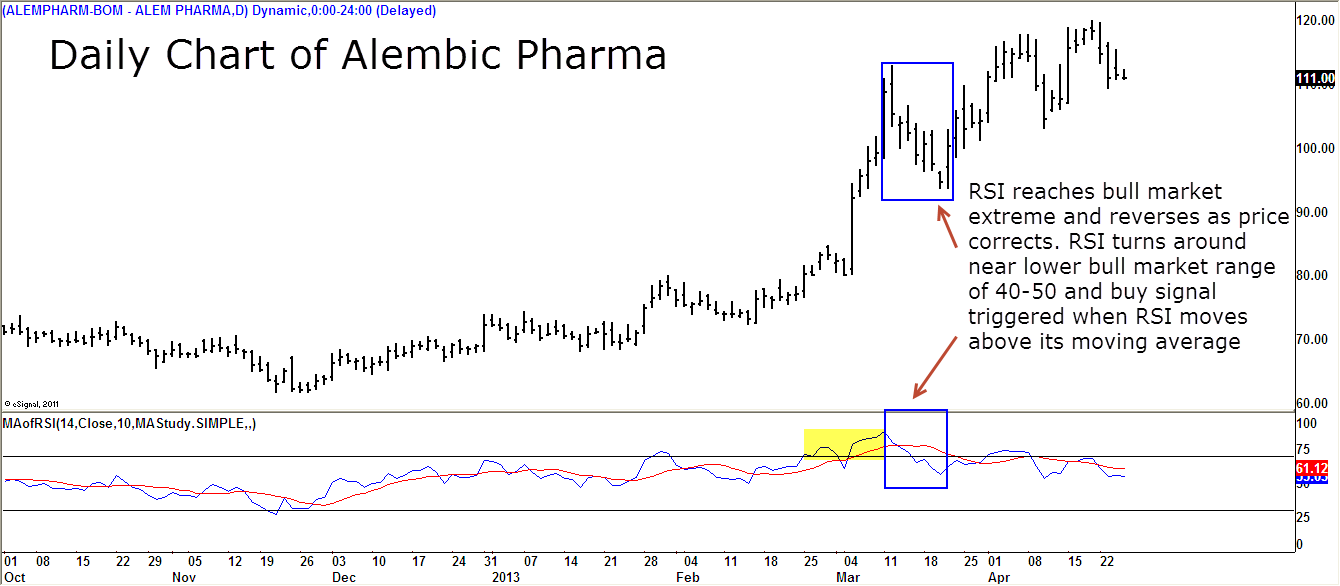
Here is another example. This is the daily chart of Alembic Pharma that was featured last.
Please be reminded that these range rules are ballpark numbers and any minor excursion out of the extremes should not be frowned upon. Use this range characteristic within overall context and don’t get too dogmatic.
A 10-period moving average is used in the above examples. Again, the idea is to demonstrate the concept. Feel free to experiment with other moving average lengths. A shorter period moving average will give the signal a few bars earlier. If you are aggressive type, shorten the length of the moving average to get an early entry.
Also experiment with different time period for the RSI. The default setting is 14-period but try other options. The RSI indicator will turn too squiggly if the length is shortened. Remember that these concepts work well in any time frame and any instrument. The key is to use it in a strong trending market and in conjunction with the underlying trend.
To he continued Next week….