
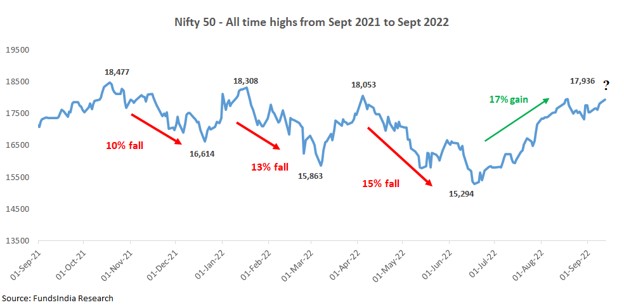
In the last few weeks, the Indian equity markets have recovered (up around 17%) and are now close to their previous all-time high levels.
Whenever markets hit all-time highs, it is natural to feel psychological discomfort. You usually get a gut feeling that the market will fall further. To add to your gut feeling, the last three times the Nifty 50 hit all-time high levels close to 18,000 levels, the markets fell 10-15%.
Now that markets are close to their previous all-time highs, it is natural to worry that the same pattern might repeat and markets will fall again.
So, should you reduce your equity exposure now and reenter back at lower levels?
Before you panic and react, let us take a look at what happened in the past when many investors got anchored to all-time high levels and assumed that all-time highs always lead to a market decline.
In the past, there were several instances, where equity markets for a temporary period got stuck in a range and saw a repeated pattern of a fall every time it hit all-time high levels. Over time, however, the market eventually breaks out, surpasses this level, continues to grow, and reaches a new all-time high.
Let us see how this works.
Between 2008 and 2011, Nifty 50 was stuck at 6,000 levels for some time…
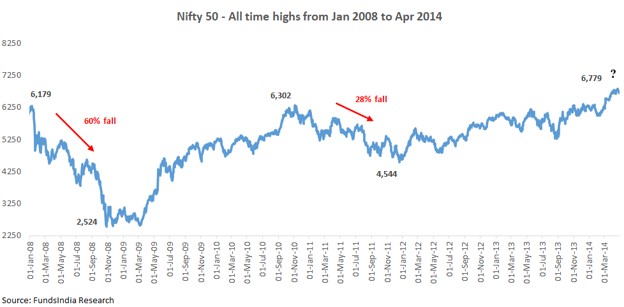
As seen above, the Nifty 50 between 2008 and 2010 hit all-time high levels around 6000 two times in Jan-08 and Nov-10. In both instances, Nifty 50 fell 60% and 28% after that.
Again in 2014, the market hit all-time high levels, and a lot of investors were already scarred by what happened in the previous two instances and assumed this would lead to another large fall.
…and then came the surprise!
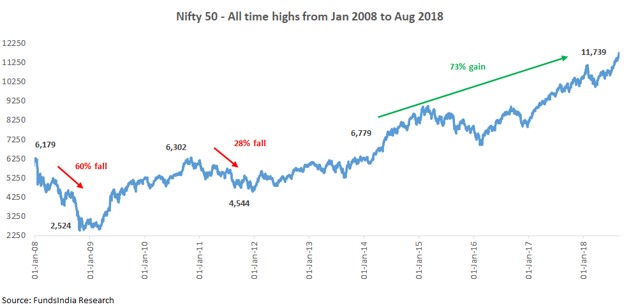
This time, the Nifty 50 eventually broke the previous 6000 levels, rallied 73%, and went on to hit new all-time highs.
Between 2018 and 2020, Nifty 50 was stuck at 12,000 levels for some time…
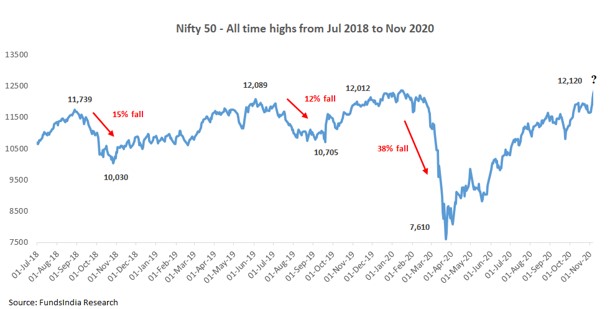
As seen above, the Nifty 50 between 2018 and 2020 hit all-time high levels (around 12,000 levels) three times in Aug-18, Jun-19, and Nov-19. In these instances, Nifty 50 fell 15%, 12%, and 38% after that.
Again in Nov-2020, the market hit the same all-time high levels of 12,000, and a lot of investors were already scarred by what happened in the previous three instances and assumed this would lead to another large fall.
…and then came the surprise!
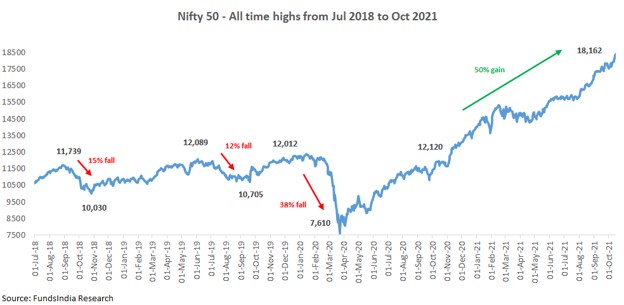
This time, Nifty 50 eventually broke the previous 12,000 levels, rallied 50%, and went on to hit new all-time highs around 18,000 levels
Now, before all this goes over our heads, let us put this together.
- The last three times the Nifty 50 hit 18,000 levels, it corrected 10-15% from there.
- Now it’s again back to 18,000 levels and it’s natural to assume it will fall again.
- But as we saw, historically the equity market after a few repeated patterns of “all-time high followed by a fall” suddenly breaks out and rallies sharply to hit newer and higher all-time highs.
Here comes the dilemma…
- What if you decide to reduce equities but the market breaks out and rallies to hit a higher all time high?
- What if you don’t reduce equities and the market corrects similar to the last three times it fell after coming close to all time high levels?
Confused?
Don’t worry. Here’s a simple framework for navigating all-time highs with a cool head.
Realisation No 1: All-time highs are a normal and inevitable part of long-term equity investing
For any asset class that is expected to grow over the long run, it is inevitable that there will be several all-time highs during the journey as seen below.
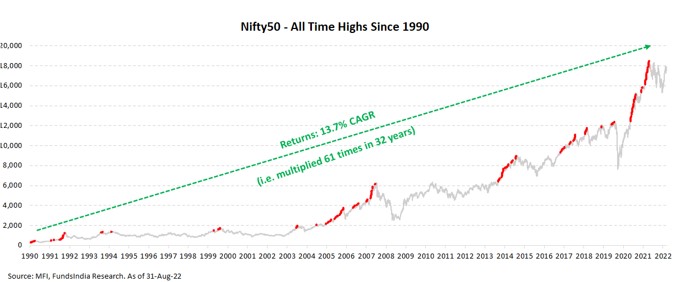
If you expect Indian equities to grow at say 12% (in line with your earnings growth expectation), then mathematically it means the index will roughly double in the next 6 years, become 4X in the next 12 years, and 8X in the next 18 years.
In other words, there will be more all-time highs along the way, and there’s nothing special or frightening about all-time highs.
Realisation No 2: All-time highs don’t mean that markets will crash immediately
For the last 20+ years, we checked for all the periods where the Nifty 50 TRI index had hit an “all-time high” level. We then checked for the 1-year, 3-year, and 5-year returns following those “all-time high” levels.
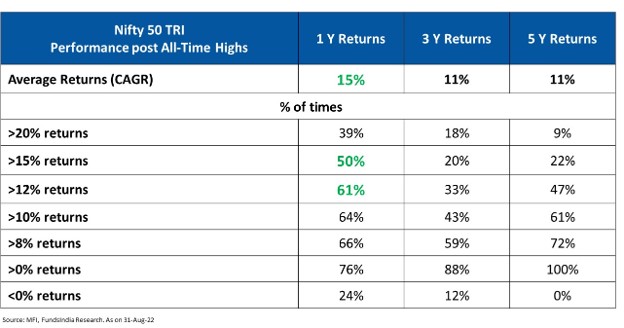
The Nifty 50 TRI gave positive returns 76% of the time on a 1-year basis, 88% of the time on a 3-year basis, and 100% of the time on a 5-year basis if we had invested during an all-time high.
The average 1Y returns, when invested in Nifty 50 TRI during an all-time high, is ~15%! (This gets even better for active funds with 20Y+ existence – HDFC Flexi cap fund and Franklin Flexicap fund – the average 1Y returns were much higher at 17% and 20%)
For Nifty 50 TRI,
- 50% of all-time highs were followed by 1-year returns of more than 15%
- 61% of the times – the 1Y returns exceeded 12%
This clearly shows that “all-time highs” automatically don’t imply a market fall and in fact, the majority of times, market returns have been strong post an all-time high.
Takeaway:
All-time highs in isolation do not predict market falls and historically investing at all-time highs has led to good short-term return outcomes the majority of the time.
While there’s no way of knowing what lies ahead in the near term, history shows us that equity markets tend to move higher over the long term. New highs are a normal occurrence and don’t necessarily warn of an impending correction. They may in fact signal that further growth lies ahead.
So, when should you actually worry?
Irrespective of whether the markets are at an all-time high or not, if the following conditions occur together, then you should worry about higher risks in the markets and re-evaluate your equity exposure:
- Very Expensive Valuations (tracked via FundsIndia Valuemeter)
- Late Phase of the Earnings Cycle
- Euphoric Sentiments in the Market (Strong Inflows from FII & DIIs, large no of IPOs, leverage, new investor participation, very high past returns, new themes collecting large money, momentum, etc)
We continuously track the above via our Three Signal Framework and Bubble Zone Indicator (which tracks 35+ indicators).
Where are we now as per the Three Signal Framework?
- Valuation: ‘EXPENSIVE’ Valuations
Our in-house valuation indicator FI Valuemeter based on MCAP/GDP, Price to Earnings Ratio, Price To Book ratio, and Bond Yield to Earnings Yield indicates the value of 73 i.e. Expensive Zone (as of 30-Aug-2022).

- Earnings Growth Cycle: Early Phase of Earnings Cycle – Expect Strong Earnings Growth over the next 5-7 years
This expectation is led by a strong structural demand for Indian IT services, Manufacturing Revival, Banks – Improving Asset Quality & gradual pick up in loan growth, Revival in Real Estate, Government’s focus on Infra spending, Early signs of Corporate Capex.
Corporate India is well positioned to capture the Strong Demand Growth led by
- Consolidation of Market Share for Market Leaders
- Strong Corporate Balance Sheets led by Deleveraging
- Govt Reforms (Lower corporate tax, Labour Reforms, PLI, GST, JAM, etc)
Early signs of a sharp pick-up in earnings growth are already visible in the last 2 years.
- Sentiment: ‘NEUTRAL’
This is a contrarian indicator and we become positive when sentiments are pessimistic and vice versa. - DII equity flows have been robust in the last 12 months. FII flows turned positive in July & August after nine months of outflows. However, the last 12 months in aggregate have seen sharp selling from FIIs – which were compensated by the strong DII flows.
- Negative FII 12M flows have historically been followed by strong equity returns over the next 2-3 years (as FII flows eventually come back in the subsequent periods).
- IPO Sentiments have tempered down
- Past 5Y CAGR (for Nifty 50 TRI) at 14% is nowhere close to what investors experienced in the 2003-07 bull market (45% CAGR).
Overall, the sentiments remain NEUTRAL.
To know more in detail about how we derive our view on the above, read our monthly reports – FundsIndia Viewpoint and Bubble Market Indicator.
Overall, at the current juncture, our Three Signal Framework indicates that markets are currently in:
Expensive Valuation + Early Phase of Earnings Cycle + Neutral Sentiments
indicating NEUTRAL ALLOCATION to Equities
So when will we go underweight equities?
TRIGGER 1: MARGINAL UNDERWEIGHT
This trigger can happen when two of the three indicators are flashing bubble signs (Valuation becomes ‘Very Expensive’ + ‘Late Phase’ of Earnings Cycle + Sentiment turns ‘Euphoric’).
Currently, none of the three indicators show signs of a bubble.
TRIGGER 2: UNDERWEIGHT
This trigger will happen when all three indicators are flashing bubble signs (Valuation becomes ‘Very Expensive’ + ‘Late Phase’ of Earnings Cycle + Sentiment turns ‘Euphoric’).
We don’t see the likelihood of Trigger 2 (i.e going UNDERWEIGHT) happening in the near term as the Earnings growth cycle is still in its early stages.
What should you do now?
- Maintain the original split between Equity and Debt exposure in your existing portfolio
- If your Original Long Term Asset Allocation split is for eg 70% Equity & 30% Debt, continue with the same (do not increase or reduce equity allocation)
- Rebalance Equity allocation if it deviates by more than 5% from the original allocation, i.e. move some money from equity to debt (or vice versa) and bring it back to the original asset allocation split
- Continue with your existing SIPs
- If you are waiting to invest new money
- Debt Allocation: Invest now
- Equity Allocation: Invest 30% now and Stagger the remaining 70% via 6 Months’ Weekly STP