We take the discussion of RSI Range Shift that was discussed last week. We take a look at a couple of examples which would provide a better understanding of the concept. The concept of range shift is very handy while determining the if a move is a trend reversal or a counter-trend pull-back. Kindly direct your attention to the daily chart of the Nifty featured below. This is an updated chart which captures today;s the price action as of 11:30 AM.
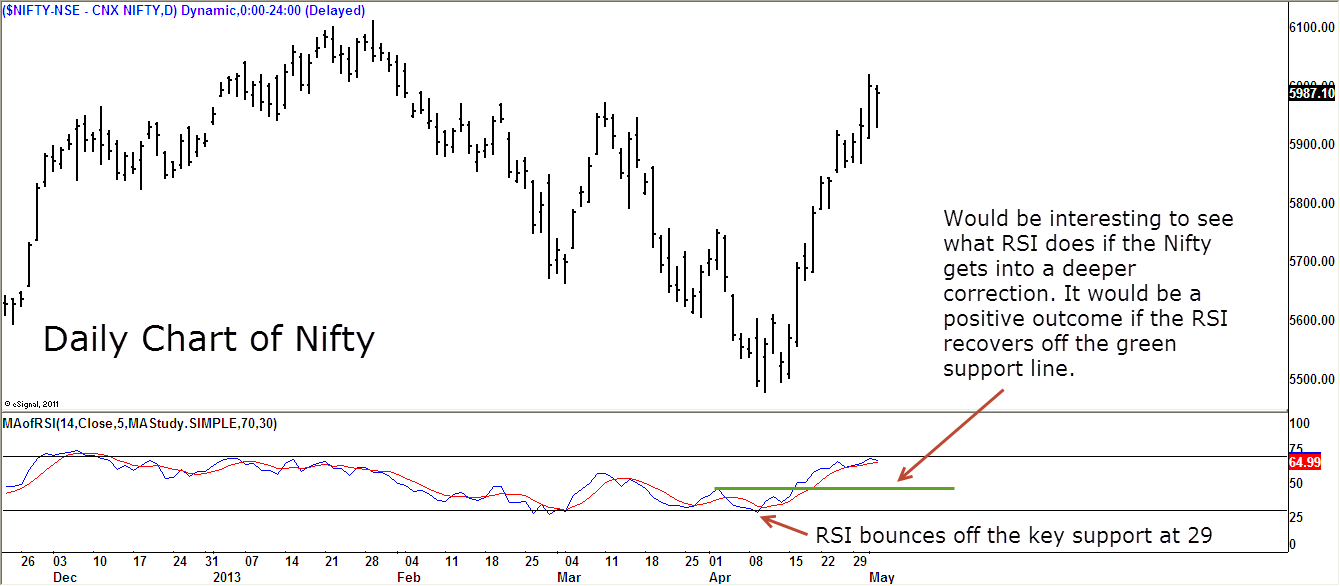
From the above chart, it is apparent that the RSI breached the bull market support range of 40-50 during the fall witnessed off the Jan.29 high of 6,112. Note how the RSI recovered from its support level at 29. The recovery off the recent low of 5,477 has helped the RSI edge past the upper end of the bear market range of 60.
The RSI is now positioned at 67 which is not a conclusive evidence of a reversal of the downtrend. It would be interesting to watch how the RSI behaves if today’s weakness spills over to next week.
It is important for the RSI to hold above the 40-mark during the pull-back to suggest a significant low is in place at 5,477. If the index fails to hold at 40, it would be a sign that we are headed to new lows below 5,477. A breakout past the 70-mark would be a conclusive evidence that the worst is over for the Nifty.
Let’s consider the case of Granules India. After a steady downtrend, the stock has been in a recovery mode in the past few weeks. Take a look at the daily chart featured below.
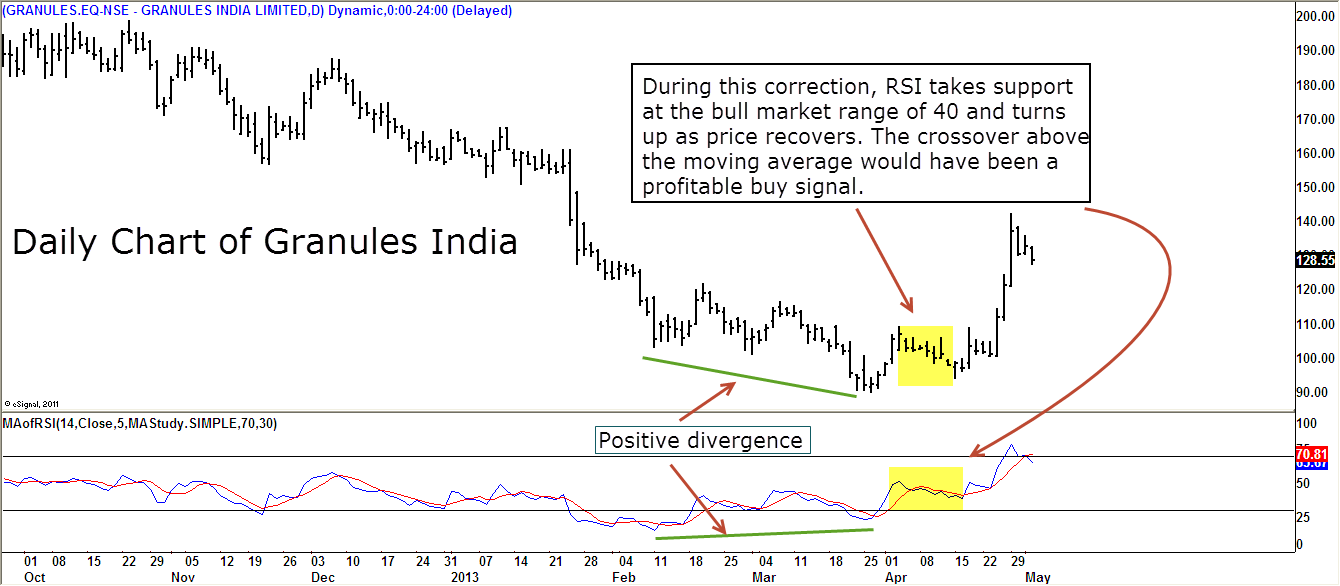
The recent recovery has pushed the RSI to the upper end of the bull market range of 40-80. The RSI made a high of 78 and has cooled off in the past few days. What is of interest is the behavior of RSI during the first pull back that transpired between April 3 and April 15. Notice how the RSI took support at around the 40-level which is the support level in a bullish market.
This was an early sign that the price could continue its upward march and the subsequent breakout past the 5-day moving average would have triggered a buy signal to participate in the next leg up. Those adept at using RSI would have also spotted the positive divergence between the price action and the RSI at the recent low of Rs.90, recorded on March 26.
Trade Safe & Don’t Get Hurt.