
The last few weeks have been quite volatile for equity markets, with a lot of news and happenings around the world.
What happened?
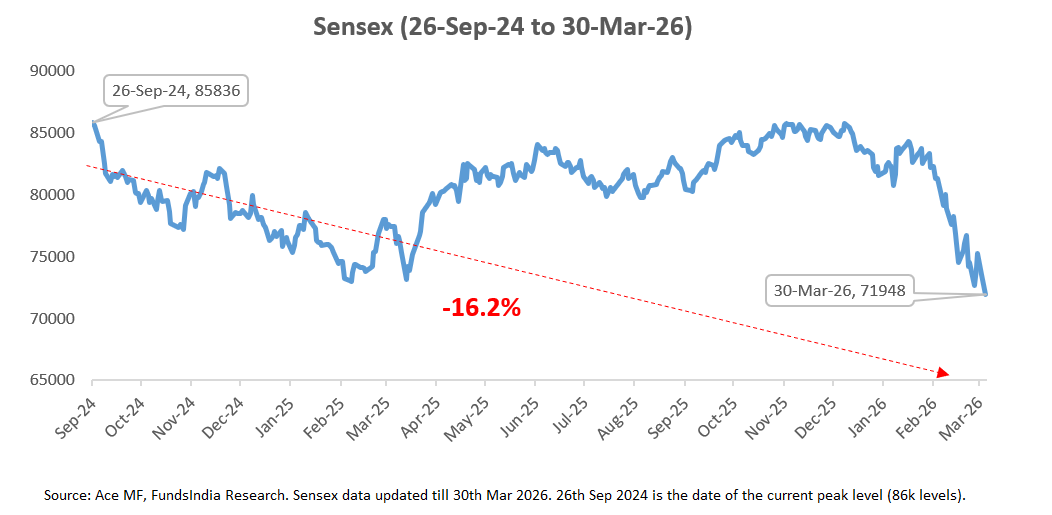
Sensex is down ~16%!
This leads to the inevitable question…
Is the current market decline a small temporary fall or the start of a large market crash?
Let me start with an honest confession…
I don’t know. Neither does anyone else.
Since we can’t predict the future, the real question is: How do we navigate this market decline?
This is where our framework comes in – helping us assess where we are in the market cycle and planning in advance for different scenarios.
What does history tell us about market declines?
The last 46+ years history of Sensex, has a simple reminder for all of us.
Indian Equity Markets Experience a Temporary Fall EVERY YEAR!
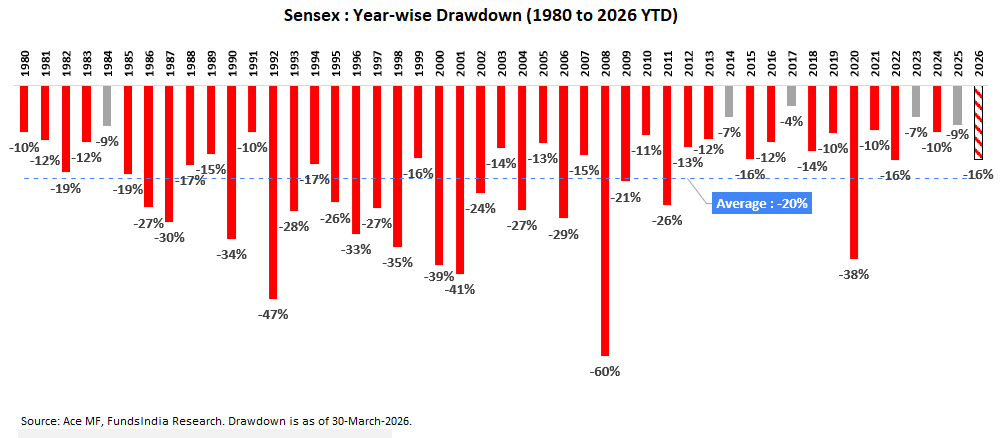
In fact, a 10-20% fall is almost a given every year!
In fact, there were only 5 out of 45 calendar years (1984, 2014, 2017, 2023, 2025) where the intra-year decline was less than 10%.
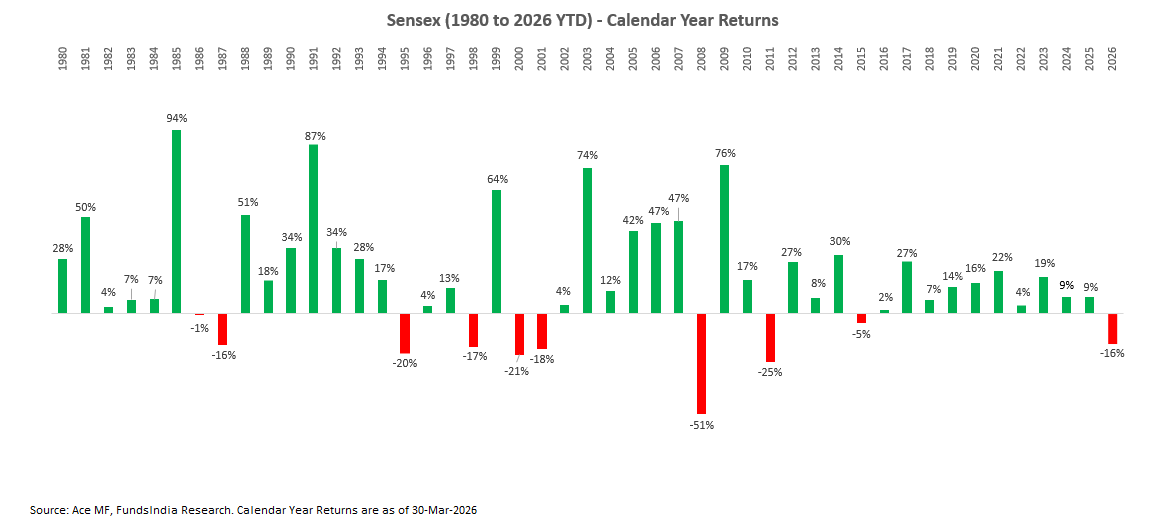
But here comes the good part. While markets faced intra-year declines of 10-20% almost every year, 3 out of 4 years still ended with positive returns, showing that these declines were usually short-lived, with recoveries happening within the same year.
Now that we understand how common a 10-20% decline is, let’s assess the current market decline. At ~16% off the peak, this decline falls well within historical norms. Viewed in context, there’s nothing unusual or surprising about it!
But what about the larger falls (>30%)?
Let us again take the help of history to form a view on how common it is for the market to have a fall of more than 30%.
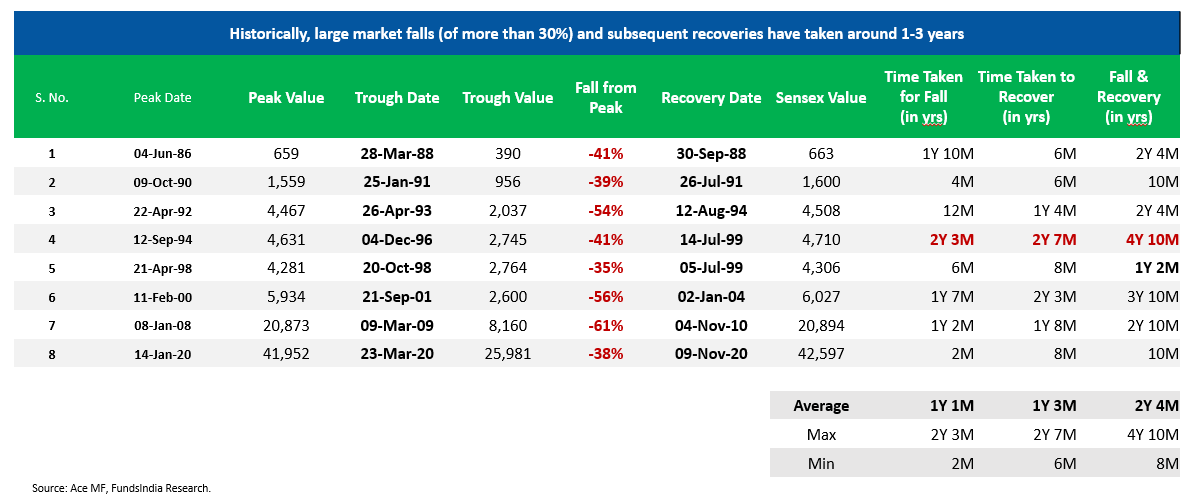
As seen above, a sharp fall of 30-60% is a lot less frequent than the 10-20% fall. They usually occur once every 7-10 years.
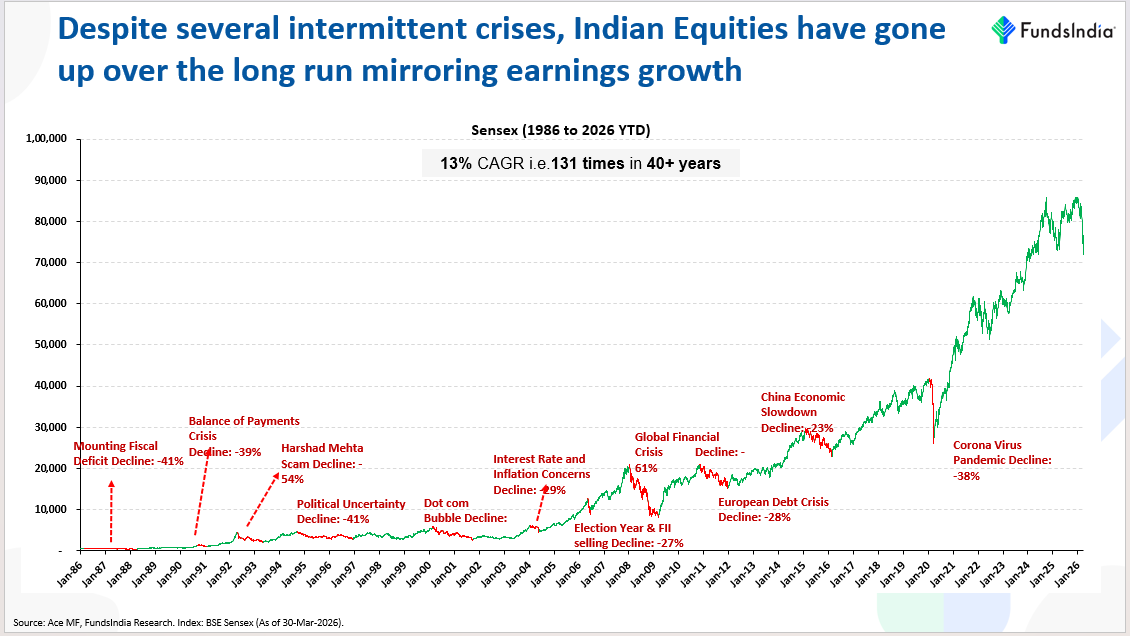
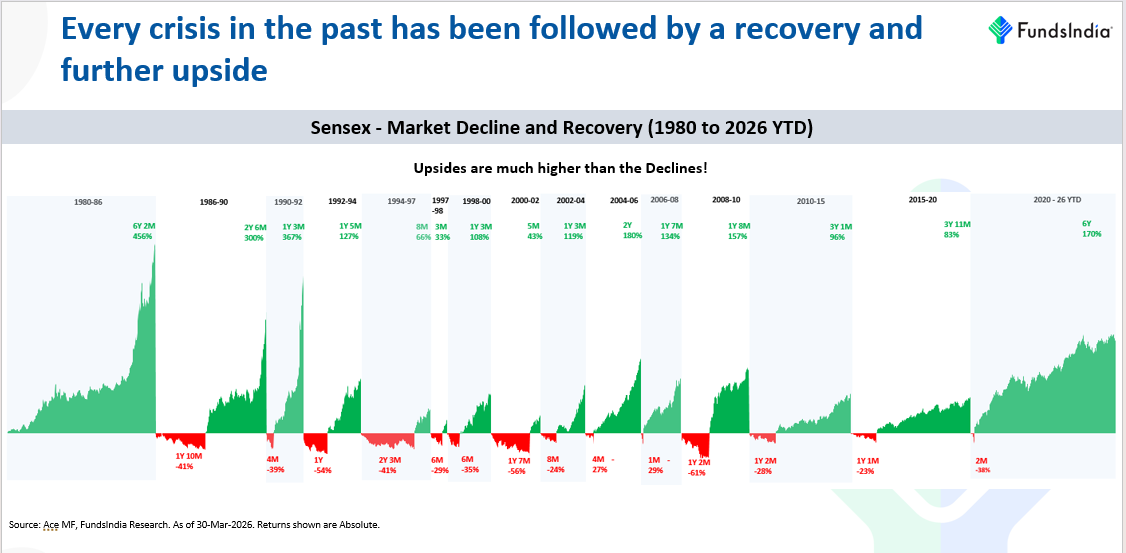
These sharp declines have also been temporary, as the Indian equity markets have consistently recovered and moved upward over the long run, driven by earnings growth.
Now that leads to the next important question.
Since every large decline will eventually have to start with a small decline, how do we differentiate between a normal 10-20% fall vs the start of a large market crash?
The equity market cycle can be viewed in three phases – 1) Bull, 2) Bubble and 3) Bear.
When in a ‘Bubble Phase’, the odds of a 10-20% correction converting into a large fall is very high.
How do you check for a Market Bubble?
A Bubble as per our framework is usually characterized by
- ‘Late Phase’ of Earnings Cycle
- ‘Very Expensive’ Valuations (measured by FundsIndia Valuemeter)
- ‘Euphoric’ Sentiments (measured via our FINAL Framework – Flows, IPOs, Surge in New Investors, Sharp Acceleration in Price, Leverage)
We evaluate the above using our Three Signal Framework and Bubble Market Indicator (built based on 30+ indicators)
What is our current evaluation?
Evaluating the above 3 signals, currently we see no signs of a market bubble as we are in
- Cheap Valuations (and not ‘very expensive’)
- Mid Phase of Earnings Cycle (and not ‘late phase’)
- Balanced Sentiments (no signs of ‘euphoria’)
Overall, our framework suggests that we are not in an extreme bubble market scenario.
Putting all this together – Here is the answer for your question
The likelihood of the current fall converting into a large fall (>30%) is very low.
There is always a ‘BUT…’
But, what if despite us not seeing a bubble at the current juncture the market corrects more than 20% (as there is still a low probability)?
As mentioned in the beginning, while the odds of a large fall is very low, there is still a small probability that this becomes a large fall. The good part is that if we get a large fall where the starting conditions are not indicating a bubble, the recoveries usually tend to be very sharp and swift (example – 2020 recovery post covid crash).
This simple insight can be converted into our advantage if we are able to deploy more money into equities from our debt/gold portion at lower market levels during a sharp market fall.
In other words if we get a fall of more than 20% correction (read as Sensex levels below 69,000), then it’s a great opportunity to increase your equity exposure. This can be put into action via the ‘CRISIS’ plan. Here is how it works:
Pre-decide a portion of your debt/gold allocation (say Y) to be deployed into equities if in case market corrects from current peak levels (86k)
- If Sensex Falls by ~20% (at 69,000 levels) – Move 20% of Y into equities
- If Sensex Falls by ~30% (at 60,000 levels) – Move 30% of Y into equities
- If Sensex Falls by ~40% (at 52,000 levels) – Move 40% of Y into equities
- If Sensex Falls by ~50% (at 43,000 levels) – Move remaining portion from Y into equities
*This is a rough plan and can be adapted to based on your own risk profile
While this may feel counterintuitive and could bring short-term pain if markets continue to fall, remember – past declines always look like opportunities in hindsight, while current declines always feel like risks.
How you respond to this decline – embracing it as an opportunity or letting fear drive you out of equities will ultimately define your success as a long-term investor.
So, what should you do now in your portfolio?
Since this decline didn’t start from a bubble, the odds of it turning into a major crash are low.
So at the current juncture,
- Maintain your original split between Equity and Debt exposure in your existing portfolio. If your Original Long Term Asset Allocation split is for example 70% Equity & 30% Debt, continue with the same (do not increase or reduce equity allocation)
- Rebalance Equity allocation if it falls short by more than 5% from original allocation, i.e. move some money from debt to equity and bring it back to original long term asset allocation.
- Continue your existing SIPs
- Make sure your equity portfolio is well diversified across different investment styles (quality, value, growth, midcap and momentum) and geographies. Kindly refer to our Five Finger Strategy for details.
How to invest new money?
- Debt Allocation: Invest now
- Equity Allocation: Invest 60% immediately and gradually deploy the remaining 40% via 3 Months Weekly STP
What should you do if the current market decline extends beyond 20%?
Activate the CRISIS Plan!
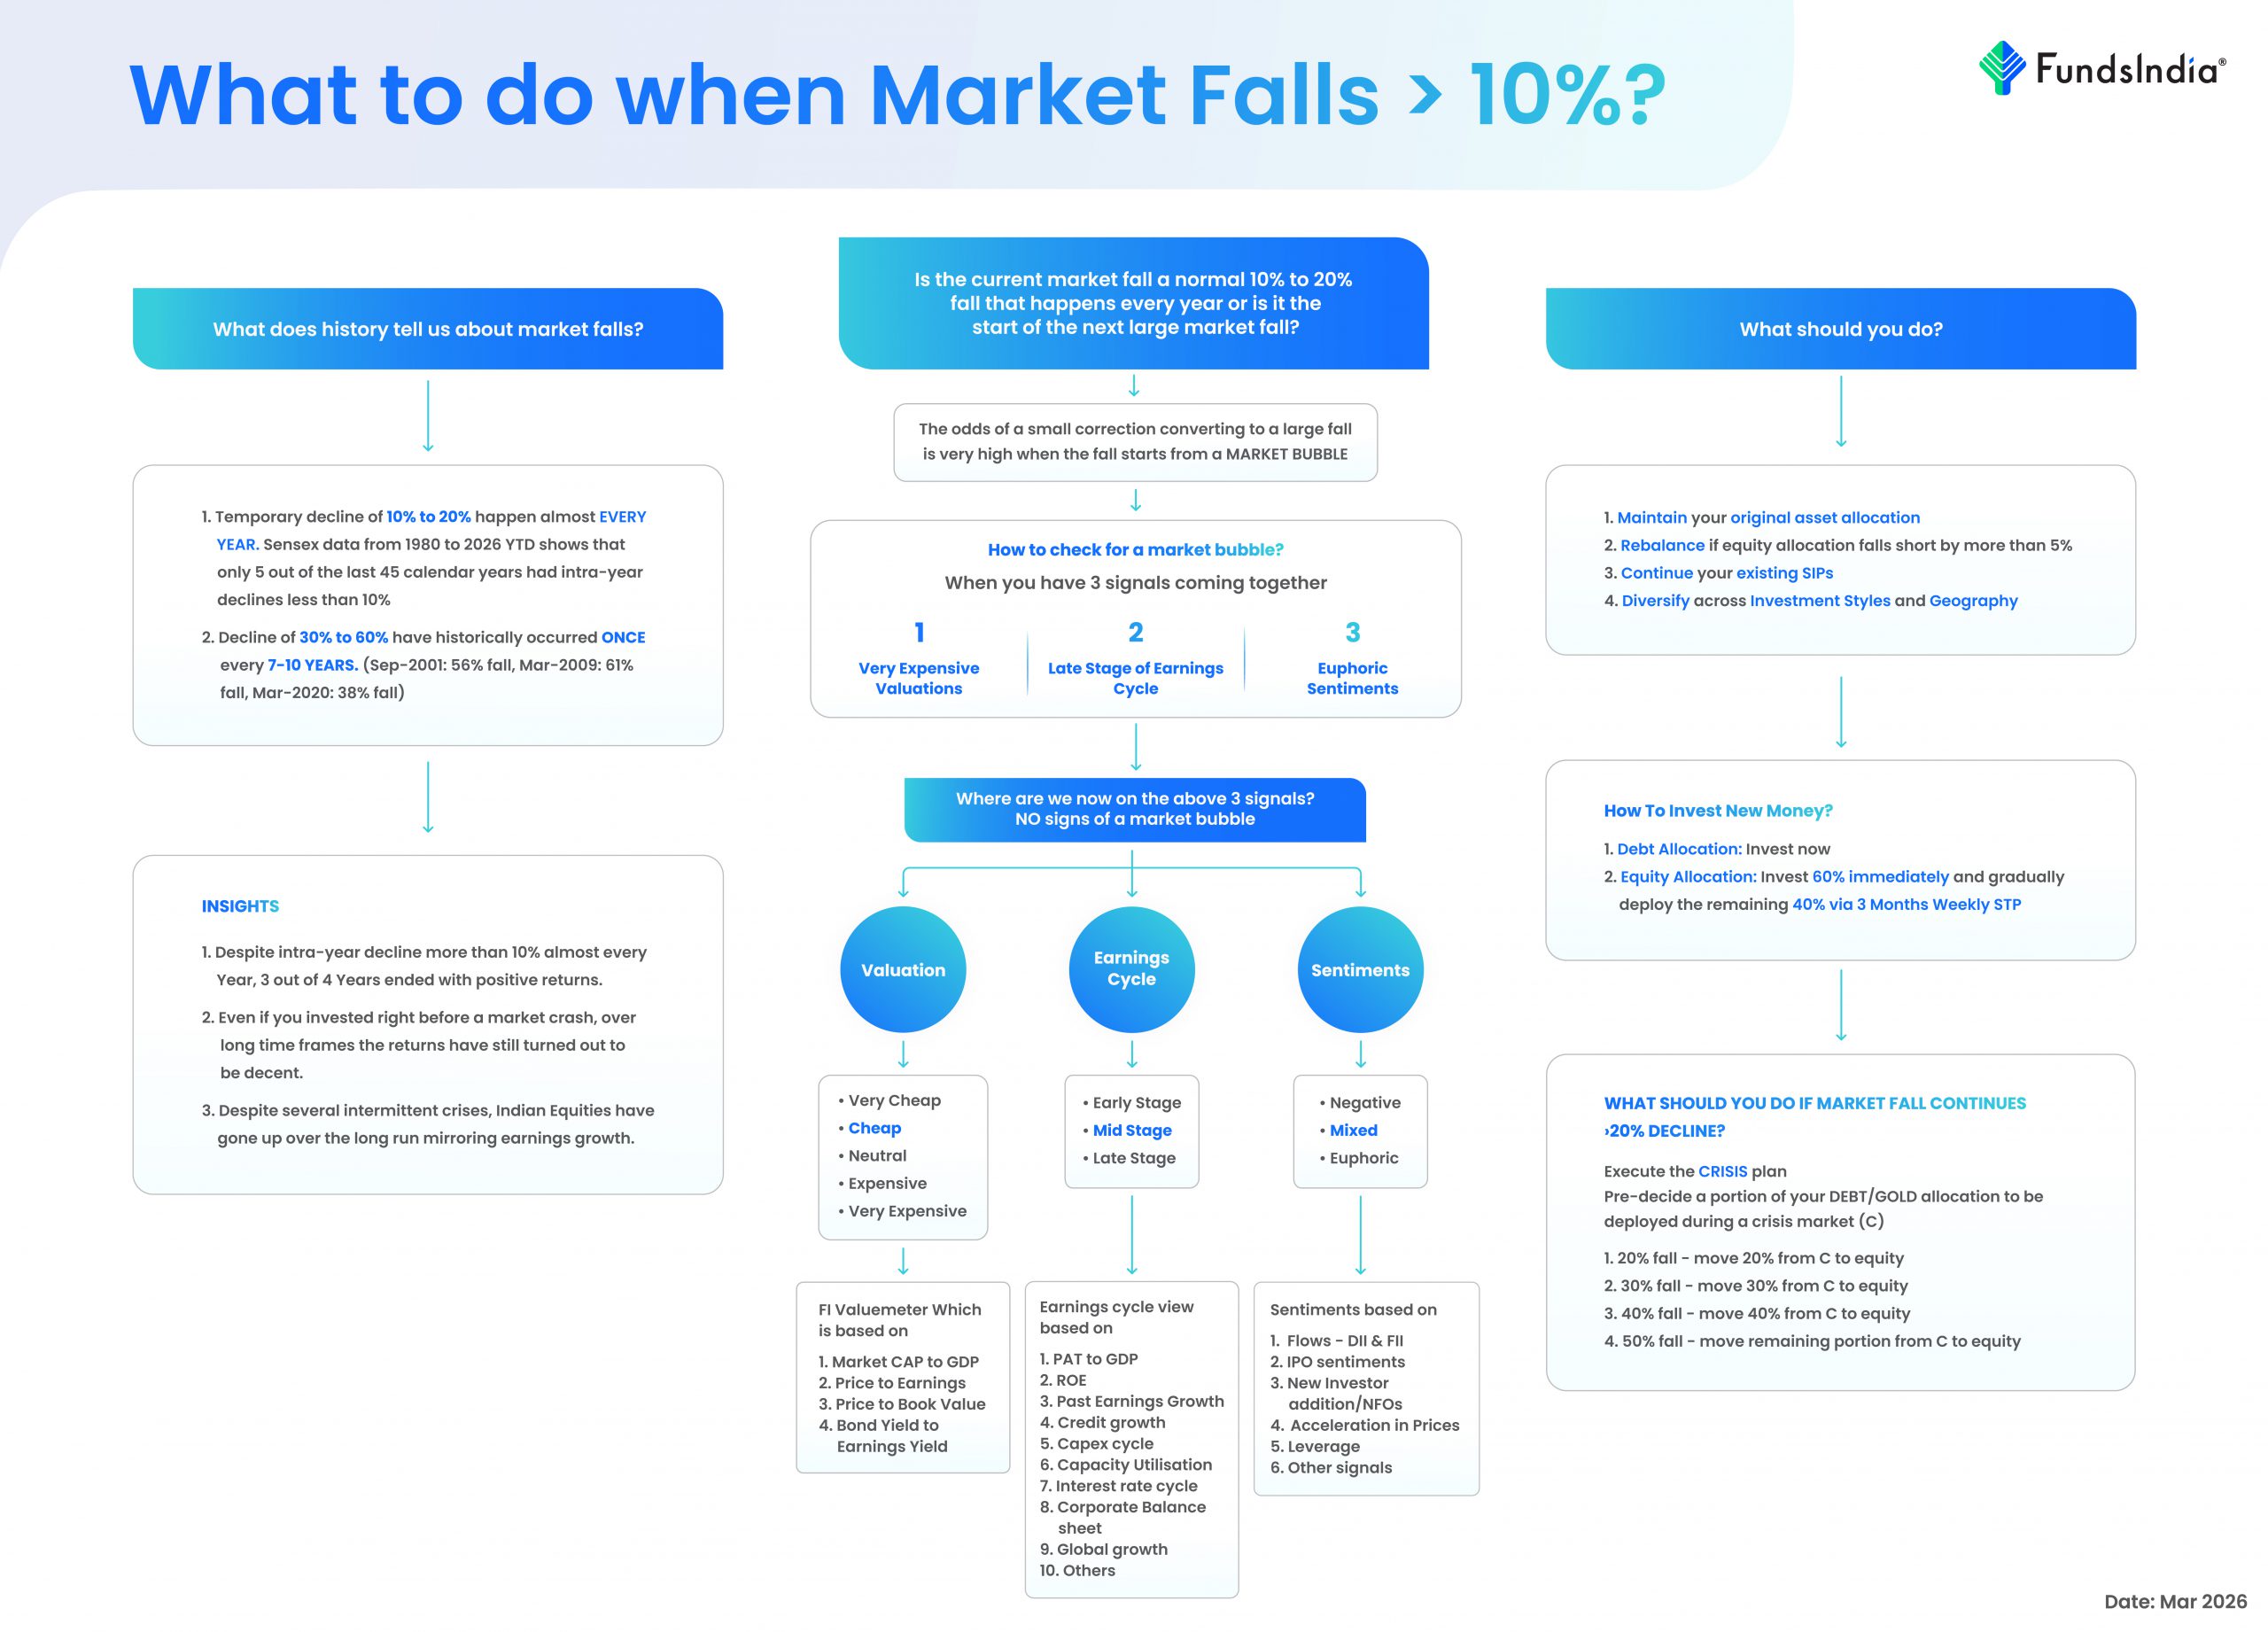
Here is a simple visual summary of how to deal with MARKET DECLINES
Annexure:
You can find a quick rationale for our Equity view based on our Three Signal Framework below:
Earnings Growth Cycle: Mid Phase of Earnings Cycle – Expect Reasonable Earnings Growth over the next 3-5 years
Why do we think we are at the middle of the cycle?
- Corporate Profits to GDP has improved from its lows of 1.6% in FY20 to 5.1% in FY25 – previous peak was at 6.4%
- BSE 100 ROE (Return on Equity) has significantly improved from its lows of 9% in Jul-20 and is currently at 18.5% – previous peak was at 25.1%
- Corporate Debt-Equity Ratio lowest in 15 years
- Capex Cycle is in the early stages – GFCF at 30% (previous peak at 35.8%)
- Credit Cycle still at early stages – 14.4% y-o-y credit growth (previous peak at >30% credit growth)
Mega Trends – Multi-Year Demand Drivers
- Acceleration in Manufacturing – Large domestic market provides competitive scale, Global realignment of supply chains (China+1), etc.
- Banks well positioned for next lending cycle – Expect pick up in credit growth + NPAs are at historical lows.
- Capex Revival – Infra + High Capacity Utilization + Early signs of corporate capex and real estate pickup.
- India as ‘Office to the World’ – Tech & Other Services
- Structural Domestic Consumption story led by Per Capita Income crossing “Tipping Point” of USD 2000 in 2019 – leads to increased discretionary spends vs essential spends as observed globally + Income Pyramid undergoing a major transition + Government focus on consumption
Corporate India Well Positioned to Capture Demand – led by Consolidation of market leader, strong Balance Sheets, several key reforms (PLI, GST etc) and digital infrastructure.
Key Risks to Monitor – Geopolitical Concerns in the Middle East, Global inflation, Central bank actions, US Tariff Uncertainty.
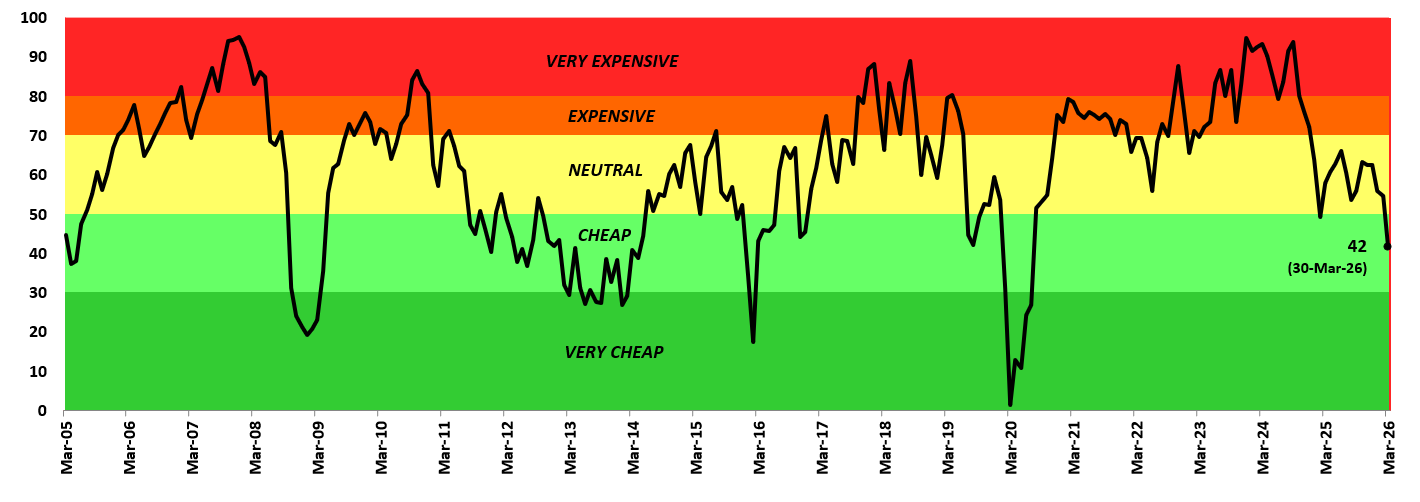
Valuations: ‘NEUTRAL’
- Our in-house valuation indicator FI Valuemeter based on MCAP/GDP, Price to Earnings Ratio, Price To Book ratio and Bond Yield to Earnings Yield has reduced from 64 last month to 42 (as on 30-Mar-2026) – and has moved to the ‘Cheap’ Zone
Sentiment: ‘BALANCED’
- This is a contrarian indicator and we become positive when sentiments are pessimistic and vice versa. Market sentiment is currently Balanced, not overly optimistic or pessimistic.
- Domestic investors (DIIs) continue to invest steadily. Over the past year, money coming from Indian investors has remained strong due to: 1) A shift in savings from physical assets (like gold and real estate) to financial assets 2) The growing habit of investing through monthly SIPs and 3) Equity investments by institutions like EPFO.
- FII Flows continue to remain weak. FII Flows have been muted for the last 4+ years -> since Oct-21 at negative Rs. ~1.4 lakh Crs vs DII Flows at Rs. ~17.9 lakh Crs. This is also reflected in the FII ownership of NSE Listed Universe which is currently at its 14 year low of 17.5% (peak ownership at ~22.1%). This indicates significant scope for recovery in FII inflows. Negative FII 12M flows have historically been followed by strong equity returns over the next 2-3 years (as FII flows eventually come back in the subsequent periods). IPOs Sentiments has slowly started to revive with many IPOs coming into the market. Despite recent volatility, market returns have been reasonable with the past 5Y Annual Return at 11.9% (Sensex TRI) lagging underlying earnings growth at 15.8% and nowhere close to what investors experienced in the 2003-07 bull market (45% CAGR). Overall the sentiments are Balanced and we see no signs of ‘Euphoria’.