Pavlov’s Dogs:
In the 1980’s Russian psychologist, Ivan Pavlov was researching salivation in dogs in response to being fed. He predicted that the dogs would salivate in response to the food placed in front of them. But to his surprise, he noticed that his dogs began to salivate whenever they heard the footsteps of his assistant who was bringing them the food.
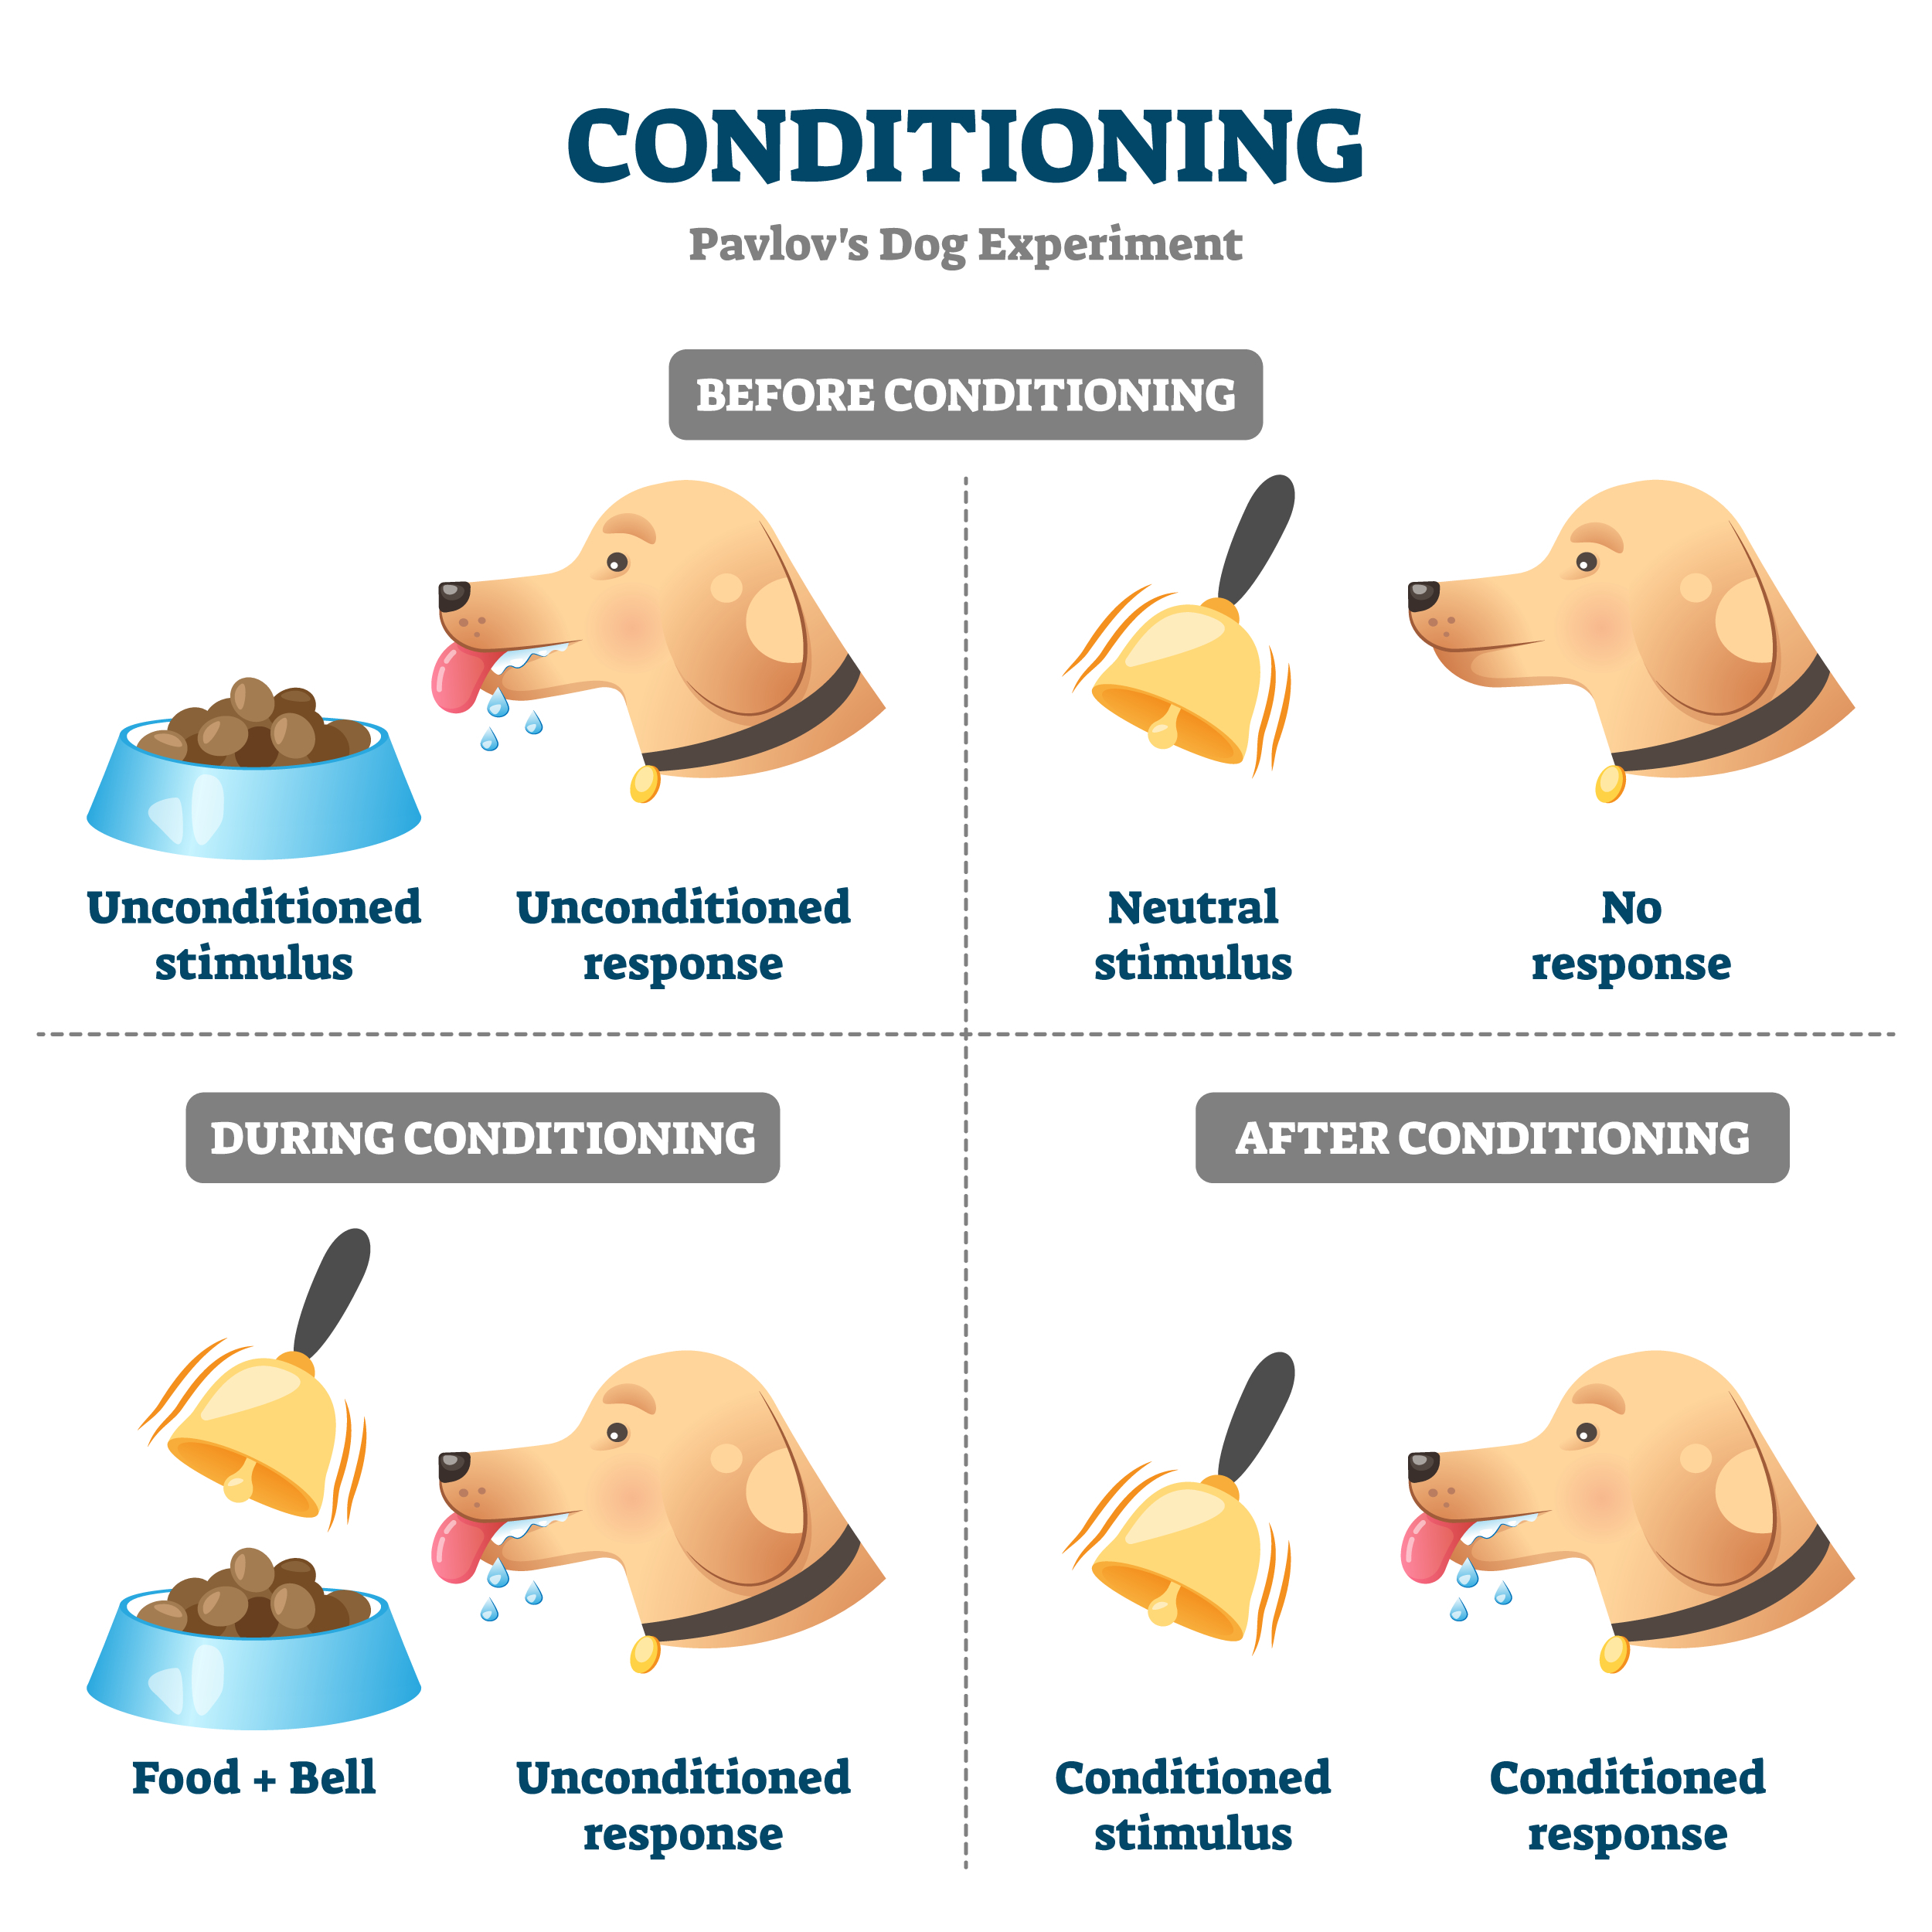
Surprised by the observation, he designed an experiment where he rang a bell just before giving food to the dog. He repeated this several times and found that the dog had started to salivate at the sound of the bell. In fact, when he just rang the bell without giving them food, they still salivated. The dog had learned to associate the bell with food.
This is called Classical Conditioning, where a neutral event such as ringing a bell (Neutral Stimulus) could be associated with another event that followed i.e. getting fed (Unconditioned Stimulus).
Now if you thought, this response only happens for dogs, here comes the shocker – this works for humans as well!
Why did Little Albert cry?
Another researcher, John Watson, was interested in taking Pavlov’s research further to show that emotional reactions could be classically conditioned in humans as well.

Source: https://commons.wikimedia.org/wiki/File:Little_Albert_experiment_(1920).webm
He took a 9-month-old child, whom he called “Albert” for his experiment. He exposed the child to different elements like a white rat, a rabbit, a monkey, masks, burning newspapers, etc. The child initially reacted with curiosity and no signs of fear.
He then started to create a loud noise behind the baby by pounding on a steel bar with a hammer on several separate occasions while showing Albert the rat. Albert cried in reaction to the noise and, after a few repetitions of the experiments, started to cry in response to the rat even without the loud noise. Other objects, when paired with the noise, also triggered the same fear response.
The Little Albert experiment is an example of how classical conditioning can be used to condition an emotional response in humans.
- Neutral Stimulus: The white rat
- Unconditioned Stimulus: The loud noise
- Unconditioned Response: Fear
- Conditioned Stimulus: The white rat
- Conditioned Response: Fear
Now, what does this have to do with investing?
Let us take a look at what happened when NIFTY reached its all-time high in recent times.
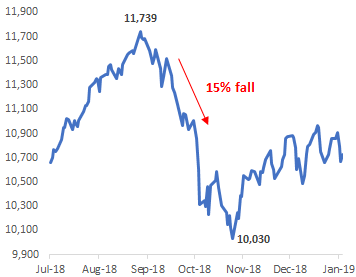
On Aug 28, 2018 – Nifty reaches an all-time high of 11,739. What happened after that?
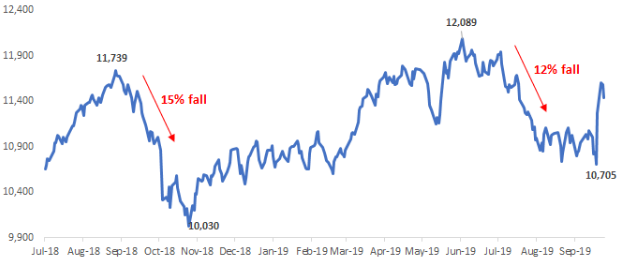
On June 03, 2019 – Nifty again reaches an all-time high of 12,089. What happened after that?
What is happening in the market now?
The Nifty has again reached close to its earlier all-time high levels!
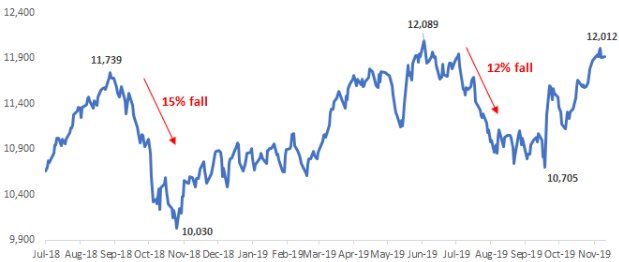
What do you think will happen?
If you immediately responded, “It should fall”, welcome to the club.
We just got PAVLOVED by the markets!
Just like how Watson had conditioned Little Albert to fear at the sight of the rat instead of actual loud sound, the market has conditioned us to fear a “market high” instead of the actual market fall due to the previous two instances of market highs accompanying a market fall.
- Neutral Stimulus: All-time high
- Unconditioned Stimulus: Market Fall
- Unconditioned Response: Fear
- Conditioned Stimulus: All-time high
- Conditioned Response: Fear
But, before you panic and sell out of equities, let us look at what happened the last time markets “pavloved” us.
2008 and 2011 – All-time highs
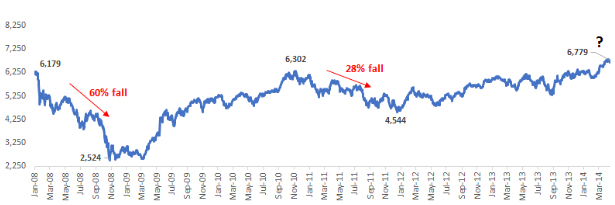
As seen above, the equity markets declined in 2008 and 2011 after reaching their all-time high levels at that juncture.
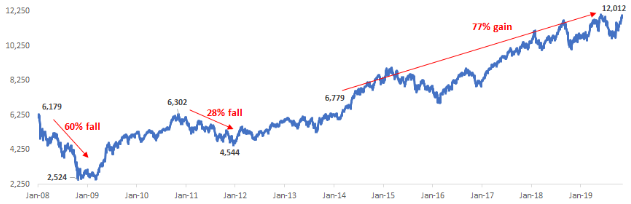
Again in 2014, the market hit all-time high levels, and a lot of us were already scarred by what happened the last two times. We were “pavloved” into associating all-time highs with the fear of declines.
A look at the below chart and you know the rest of the story!
Now that you have realized how the market messes up with our emotions, let us put our logical lens to approach “all-time highs”.
Reframe “All-time highs” in the right perspective:
Zoom out a bit and take the long term perspective.
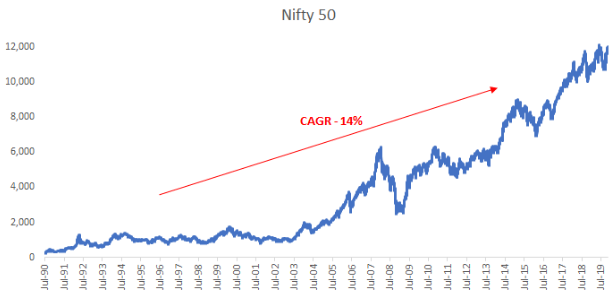
As seen above, in the long run, Indian equity markets have tracked earnings growth and have grown at 14% CAGR.
If we expect markets to provide higher returns beating inflation and go up over the long run, it is only natural that there will be several all-time highs during the journey.
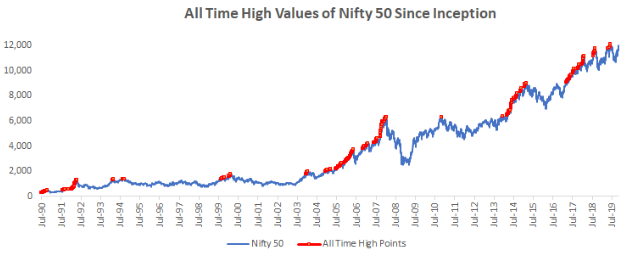
Just like how in gold and real estate we don’t give too much of an importance to all-time highs and brush it off as “anyway, in the long run, it will go up”, we need to start considering “all-time highs” as a normal and regular part of long term markets.
All-time highs don’t mean that markets will fall immediately:
Now while we anecdotally saw how the market tricked us the last time in 2013, let us check for some actual evidence on how the market has behaved after an “all-time high”.
For the last 15 years, we took out all the month-end dates of Nifty TRI index where it had hit an “all-time high” level. We then checked for the 1-year and 3-year returns following those “all-time high” levels.
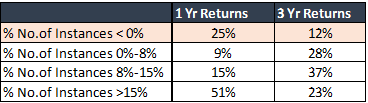
As seen above, the Nifty gave positive returns 75% of the time on a 1-year basis and 88% of the time on a 3-year basis. In fact, more than half of the instances were followed by 1-year returns of more than 15%!
So this clearly shows that “all-time highs” automatically don’t imply a market fall and in fact, majority of the times, market returns have been positive post an all-time high.
Now comes the most important question.
Ok. You understand that all-time highs don’t mean an immediate market fall. But still, you are feeling uncomfortable and would want to know as to what will happen to the markets over the short term?
The honest answer is we cannot predict. Nor does anyone else. But we take the humble “probabilities” approach over a prediction approach.
Based on history we know that the Nifty over a 6 month period, 95% of the times has provided returns which fall between the range of -27% to +61%. Now to tell where it will fall in this range is impossible, but the takeaway for us is that this should be considered as “normal” behaviour from the equity markets.
The extreme events representing the remaining 5% of outcomes cannot be quantified. However, just to set a realistic context, the last time there was a crisis in 2008, the Nifty had fallen up to -60%.
But what if this is the start of a severe crash?
Now while there is no precise way to predict the markets, however, it pays to be aware of where we are in the cycle. Equity markets go through 4 parts of a cycle – Bull, Bubble, Bear, and Deep Value.
The risk of a severe crash is pretty high when the markets enter the “Bubble” zone.
So while not a precise science, based on the past study of bubbles, usually a bubble zone is characterised by extreme valuations, strong corporate earnings, very high past returns, euphoric sentiments (a particular theme receiving high inflows, increased demand for IPOs etc), high inflows from both FIIs and DIIs.
When we evaluated the above parameters, the usual signs of a bubble are missing. Hence, we believe that we are still in the bull phase and are yet to reach the bubble phase. So the probability of a sudden severe crash in our view remains very low. (Obviously, the corollary being there is always a minuscule chance)
The focus should shift from “All-time highs” to Earnings growth and Valuations:
As seen above, all-time highs are nothing to panic about and the real attention should be on monitoring valuations, sentiments and earnings growth to evaluate where we are in the cycle.
Summing it up
- Just like how Watson had conditioned Little Albert to fear at the sight of a rat instead of the actual loud noise, the market has conditioned us to fear the sight of a “market high” instead of the actual fall
- The key is to remember that, as seen in past instances “All-time highs” don’t automatically mean immediate correction – in fact, 75% of the times, the 1-year returns post a market all-time high has been positive
- All-time highs are a normal part of long-term equity growth
- The focus should remain on valuations, sentiments and underlying earnings growth instead of “All-time highs”
- Currently, we are still not in the “Bubble” part of the cycle for equities
- Continue with a positive stance on equities and stick to your investment plan


The Nifty PE ratio is at 27.6. The valuations are not cheap when compared to historical data. The growth outlook doesn’t seem very positive going by GDP numbers and projected growth. Stock markets and economy are taking different directions. Based on this, don’t you think investors should be cautious and not be investing more in Equities. All the time, I see “advice” to increase allocation to equities. I am yet to see a not saying that the valuations are expensive and to be cautious.
True. Even at this level of highest PE ratio and contrasting GDP (perhaps lowest in last 5 years), it is amusing that some articles still says we are not in bubble zone. This is like people are losing jobs and market is cheering that profitability is going to increase.
if anyone is claiming that this is a bubble zone then the next move should be crash, but then who can predict that?! Only guidance is perhaps the asset allocation!
Well written article!! Thanks.