Some time ago, we looked at what compounding is all about and how your money multiplies under compounding . When money compounds over several years, the finance world use a simple metric called compounded annual growth rate (CAGR) that helps gauge the annual compounded returns of your investment, over several years. The returns that you see in your mutual funds for periods more than one year is CAGR. If you are wondering how CAGR is different from the usual absolute returns, do see the example below.
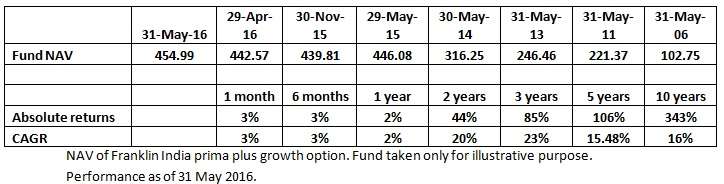
As seen above, returns up to one year remain the same whether it is absolute returns or CAGR. But look at the three-year period. The fund generated an absolute return of 85% in three years. Rs 1000 invested 3 years ago would be Rs 1850. In other words, your money almost doubled. It’s CAGR is however only 23%.
CAGR simply tells you how the initial investment of Rs 1000 grew year-on-year to reach Rs 1850. Hence, a CAGR of 23% means an average return of 23% per year over the last 3 years. However, in reality, in those 3 years, your fund could have fallen in one year and run up steeply in another. CAGR simply normalises this to let you know the returns over the time frame you choose, irrespective of individual year performances were.
So why do we have to look at CAGR? The main reason to use this metric is to be able to compare returns across asset classes and other economy parameters like inflation and growth. For instance, whether you put your money in deposits for 3 years or 5 years, it is common parlance to say that it gives you an interest of say 8% per annum. You never say it gives 26 (absolute return)% for 3 years. The compounded annual rate makes it easier to compare. Similarly, when you look at an inflation number of say 7% annually and your fund has a CAGR of 23%, this gives you an indication that you are generating real returns over and above inflation.
Which is greater?
Looking at the table above, a question might arise as to whether the three-year CAGR is greater than the five-year CAGR. True, over the above 5-year period, the rate of return may have been slower compared with the 3-year growth. This could be because the initial 2 of the 5 years may have been lacklustre. But it could be the reverse too. There could be periods when 3 year-returns appear lacklustre compared with 5 years as the last few years may have been volatile.
Hence, it may not be right to conclude from the above data that short-term returns are better than long term. The question is whether you will build more wealth by staying longer. And you certainly would have gained more, in the above case. Hence, instead of comparing returns across different time frames, simply use the data to compare returns for a given time frame across funds. The three-year returns of Franklin India Prima Plus for example, may be compared with say Mirae Asset India Opportunities.
Use CAGR as an effective tool to compare returns of a fund with its benchmark and its peers. It can also give you a sense of what sort of annual return the fund has delivered in the past and thus can be compared with other investment products.