Hope the earlier posts on RSI was informative and interesting. This week, let’s discuss the much talked about divergence. The positive and negative divergence are the ones that are most popular amongst the technical analyst. The positive divergence occurs when the price makes a new swing low while the RSI makes a corresponding higher low. This divergence between the price action and the RSI is termed as positive divergence.
A negative divergence occurs when the price makes a new high which is not corroborated by the RSI. What are the implications of a positive / negative divergence? Typically, when a negative divergence occurs, it is viewed as a forewarning of an impending reversal in the underlying uptrend. Similarly, when a positive divergence occurs, it is viewed as a sign of a possible reversal in the downtrend.
The divergence is a signal that the underlying trend is decelerating or the momentum behind the trend is slowing down. A slowdown in momentum is an early sign that the trend could stall and reverse soon.
A divergence by itself is not a conclusive sign of a reversal or an impending reversal. In this context, it must be mentioned that the RSI is constructed to oscillate between zero to hundred. Because of its construct, the price will typically throw up several successive positive or negative divergence while the underlying trend is intact.
After a series of positive or negative divergence, the trend reversal would eventually happen. To put in simple terms, there would invariably be a divergence ahead of a trend reversal but every instance of a divergence is not to be mistaken as a forewarning of trend reversal.
Take a look at the daily chart of Century Textiles posted below.
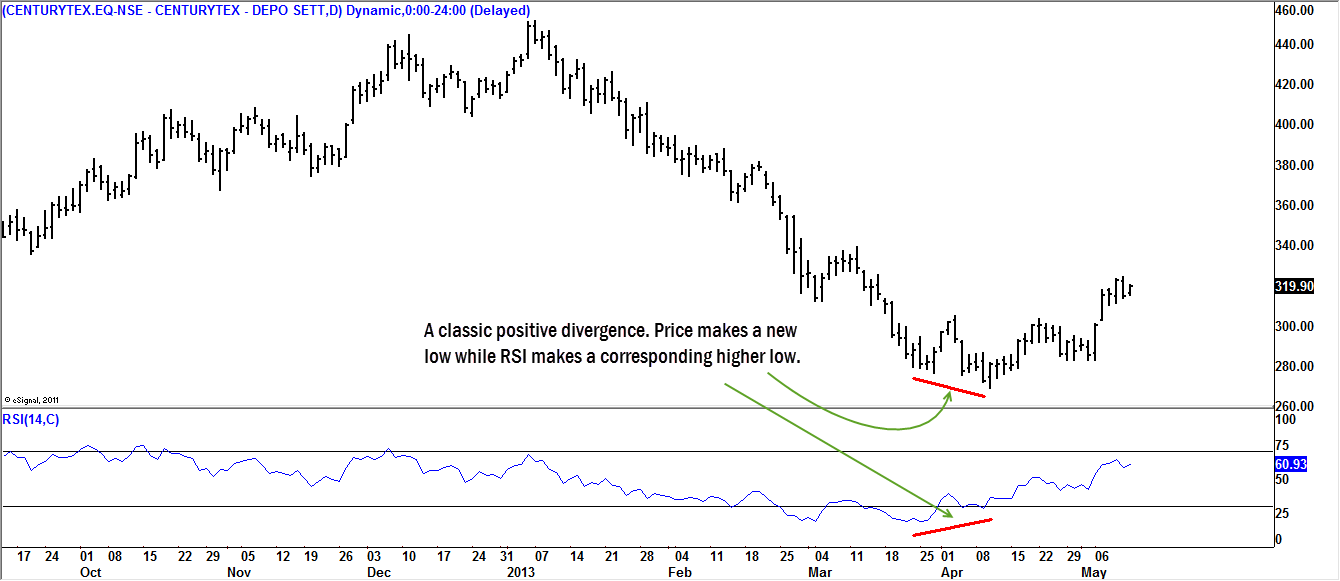
Notice how the price has been in a steady downtrend. Towards the end of the downtrend, notice how price made a relative new low while the RSI made a corresponding higher high. In the above chart, there was an instance of positive divergence earlier as well when price made a new low but the corresponding low in the RSI was almost at the same level. But, the divergence had little meaning as the price continued to head lower.
For trade decisions, it would make sense to draw a trendline or use some other form of an additional confirmation, to suggest trend reversal, before considering a trade. This is essential because chances are that you will be tempted to buy anticipating a reversal while price can still continue its trend. This would lead to the typical mistake of fighting the underlying trend which is a perfect recipe to burn the trading capital.
We shall continue this discussion on divergence in greater detail next week.