
Successful trading is all about making the right decisions at the right times, and an integral part of this process lies in reading charts. Though predicting markets isn’t something that can be made with certainty at all times, there definitely are a few ways that assist us in making the right decisions. Here’s when Multi-time frame analysis comes into play.
What is Multi-Time Frame Analysis?
Multi-time frame analysis is a process of making trading decisions by viewing the same asset under different time frames. This method helps the traders to find the overall trend of the underlying asset. The multi-timeframe analysis is a powerful strategy that enables a trader to increase the probability of winning trades and minimize the risk.
How to perform a Multi-Time Frame Analysis?
The general rule is that, the longer the multi-timeframe analysis the more reliable signals are. This strategy follows a top-down analysis for trading and allows traders to find the long-term trend using a longer time frame and identifying an ideal entry/exit on a chart with a shorter time frame.
Helps in making a better decision
Multi-timeframe analysis helps traders of all types, including scalpers, day traders, swing traders, and position traders to make better trading decisions. For example, a stock can be in a strong uptrend on a 5-minute chart, but when compared to a daily chart, you can find the stock trading in a tight consolidation band. The strategy also helps in finding the key support and resistance level of the underlying asset. By including multi-dimension of time in your analysis, you can have a clear edge over other traders who take decisions based on a one-time frame.
Three-time frequencies Strategy
We recommend traders look into three different timeframes of the underlying asset before they initiate a trade. The longer time frame chart will help you confirm the overall trend. The medium time frame helps in identifying key support and resistance levels. Finally, the shorter time frame chart will help you in finding the entry/exit levels.
There are no best time combinations to use the strategy, as the traders use different time frames based on their trading style. Below are a few different time frames used by the traders.
Scalpers are the ones who initiate and close trades once a small profit/loss is made.
For scalper, the ideal combination is 30-minute, 15-minute, and 5-minute. FOr traders who use the 1-minute trading strategy, then an ideal combination can be a 15-minute, 5-minute, and 1-minute chart.
Day traders are the ones who open and close trades within a day and do not carry forward to the next market day.
For day traders, an ideal combination can be a 1-day, 1-hour, and 15-minute charts.
Swing traders are the ones who initiate trades and then hold them for a few days.
For Swing traders, the combination can be daily, 4-hour, and 1-hour charts.
Let’s explain with an example of a day trader
As discussed earlier the trades should be taken based on short-term time frames as the small changes in price action become clearer, a trader will be able to pick an attractive entry whose direction has already been confirmed by the higher frequency charts.
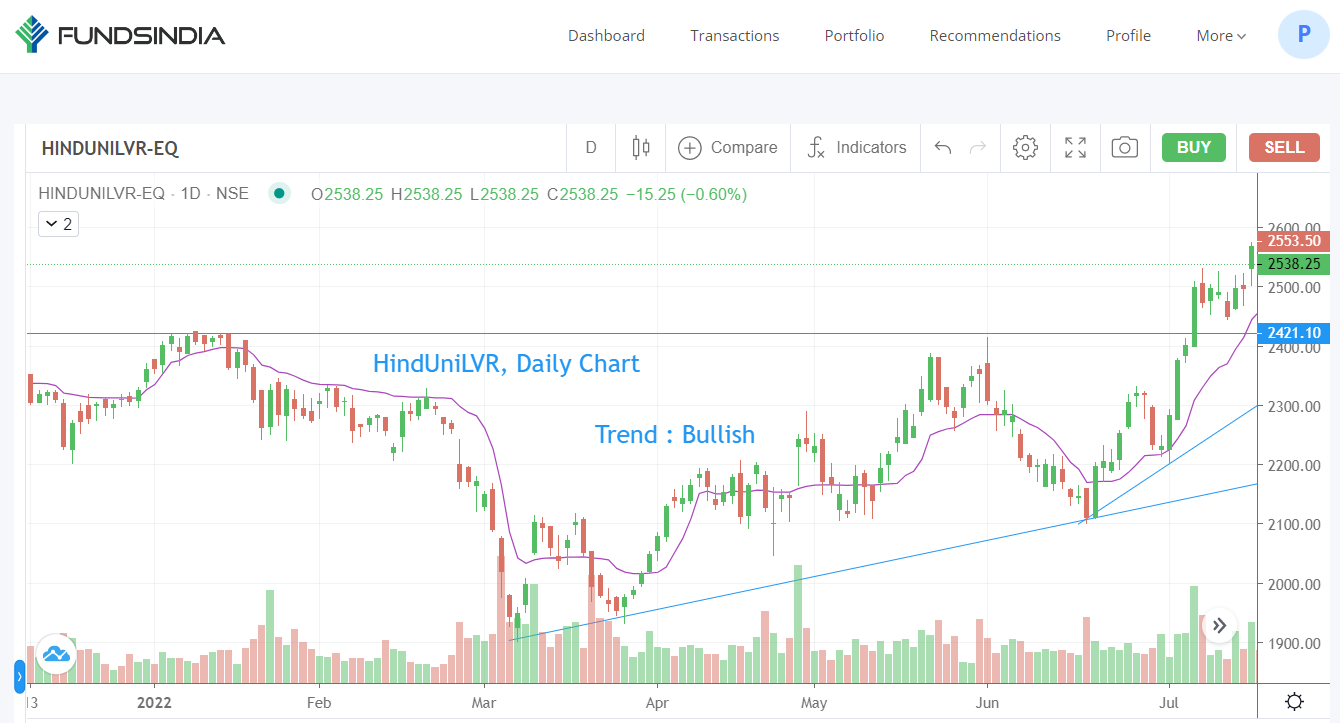
The daily chart of Hindustan Unilever shows the overall trend remains bullish
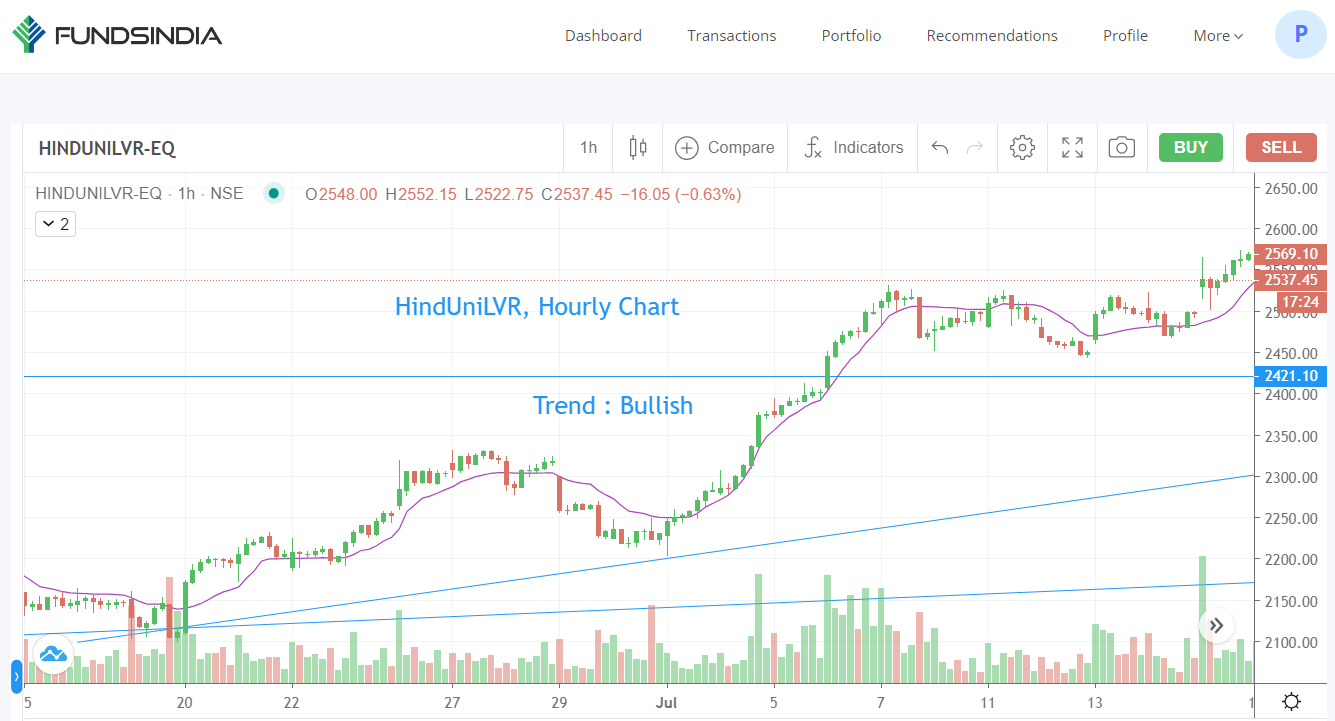
The hourly chart of Hindustan Unilever also indicates bullishness to continue.
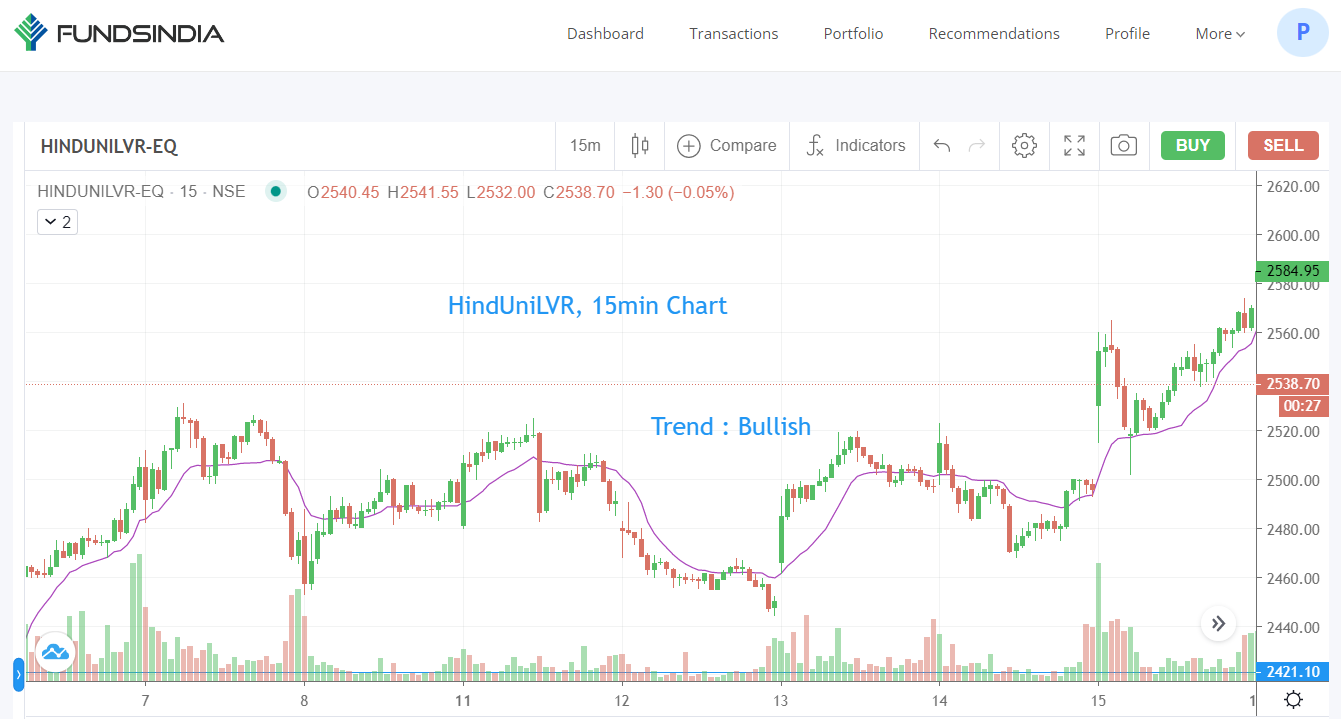
The 15-minute chart is also looking bullish and the trader gets confirmation on all the time frames and can increase the probability of a profitable trade and reduce a loss-making trade.
Key Takeaways
Multi-time frame analysis is a popular tool used by traders to analyze trends. The longer time frame trading is used to find the overall market direction, the medium time frame helps in identifying the support/resistance levels and a shorter time frame is used to find an entry/exit for the trade. There are no strict rules to follow with the three-time frequencies Strategy. Additionally, you can also try using four or more-time frequencies to identify the trend that works best for you.
That’s all for this post. We hope you learned something new from this post.
Happy Investing and Trading!😉