
Price Action Overview:
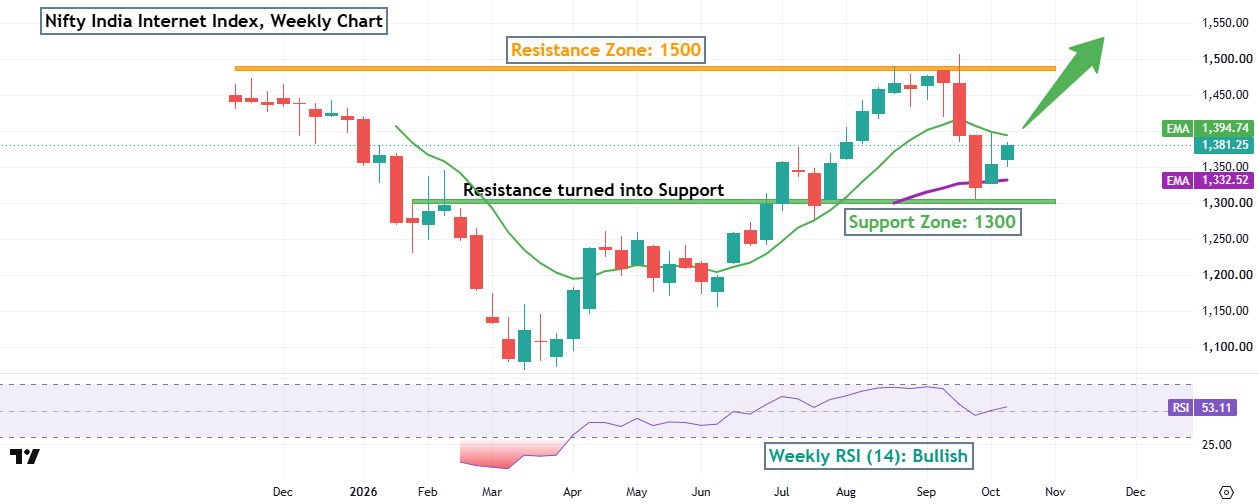
On the weekly chart, the Nifty India Internet Index has given clear candlestick signals at important levels. In early July 2026, a strong green candle closed above 1,300, a level the index had struggled to cross earlier. When it slipped back towards the 1,300 level in late July 2026, buyers stepped in quickly. Through August 2026, a series of green candles with small upper wicks showed steady buying with little selling, taking the index close to the 1,500 level. In the third week of September 2026, a red candle with a long upper wick near 1,500 showed that sellers pushed the index back from the high, and another red candle followed. This second red candle left a lower wick near 1,300 and closed near the 200-day EMA, showing that buyers defended this zone. The last two weekly candles of October 2026 have closed green, pointing to fresh buying at lower levels.
The index is currently trading at 1,381, comfortably above the 200-day EMA at 1,332 and close to the 50-day EMA at 1,395. The 50-day EMA remains above the 200-day EMA, keeping the overall moving average structure positive. A weekly close above the 50-day EMA would add further strength to the recovery. The weekly RSI 14 is at 53.11 and has turned higher after dipping below 50, showing improving momentum with plenty of room before the overbought zone. The 1,500 level remains the key resistance. A strong weekly close above 1,500 could confirm a fresh breakout, while 1,300 remains the key support level to watch during any correction.
Trend Analysis:
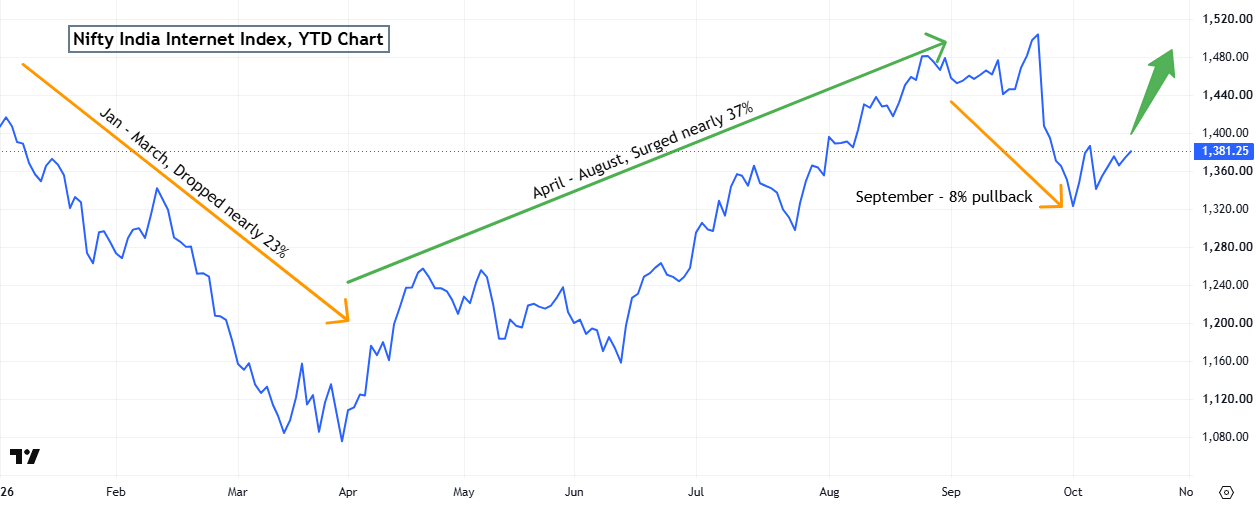
The index started 2026 on a weak note, falling nearly 23% between January and March, as the West Asia conflict and fears of AI-led disruption weighed on online platform stocks. The trend reversed sharply from April, with the index surging nearly 37% through August, supported by broad-based buying across constituents. In September, the index corrected 8% due to sector-wide pressures. IRDAI’s proposed commission caps for insurance distributors weighed on listed Insurtech platforms. Large block deals by private equity investors exiting listed digital payments companies added supply pressure. Rising US bond yields further weakened sentiment towards high-valuation growth stocks. Despite this, the index has recovered in October, and the broader structure of higher highs and higher lows since April remains intact.
Leading Picks in the Internet Space:
- GROWWNET – Groww Nifty India Internet ETF.
- ETERNAL.
- PAYTM.
- GROWW.
Conclusion:
The Nifty India Internet Index has held the key 1,300 support zone after the September correction, and the recent bullish weekly candles indicate that buyers are returning at lower levels. The positive alignment of the 50-day and 200-day EMAs, along with an improving weekly RSI, supports a continued recovery. A move above the 50-day EMA could pave the way for a retest of 1,500, and a decisive breakout above it could extend the rally further. On the downside, a weekly close below 1,300 would weaken the bullish structure.
Key supports: 1,300 / 1,260 / 1,200.
Disclaimer: Investments in the securities market are subject to market risks, read all related documents carefully before investing. Securities quoted here are exemplary, not recommendatory. Please consult your financial advisor before investing. Please note that we do not guarantee any assured returns for the securities quoted here.
Research disclaimer: Investment in the securities market is subject to market risks. Read all the related documents carefully before investing. Registration granted by SEBI, and certification from NISM in no way guarantee the performance of the intermediary or provide any assurance of returns to investors.
For more details, please read the disclaimer.