
Asset Allocation refers to how you split your money across different assets such as Equity, Debt, Gold etc.
This deceptively simple decision is probably the single most important decision when it comes to investing your money.
Academic research demonstrates that approximately 80-90% of your long-term investment returns and investment experience can be traced back to your asset allocation decision.
The deceptive simplicity of the decision, however, often leads to underappreciation of its effectiveness.
Given the significant importance of this decision, here is a framework that will help you make a sensible and informed asset allocation choice.
The Usual Approach
Usually when you are asked to decide on your asset allocation, you are shown some variation of 4-5 asset allocation models with fancy names such as conservative, moderate, aggressive etc. All these models will usually have varying degrees of equity exposure with the broad assumption – higher the equity exposure higher the risk/returns and vice versa.
Here is a rough version:
- Risk Level 1: 10% Equity: 90% Debt
- Risk Level 2: 30% Equity: 70% Debt
- Risk Level 3: 50% Equity: 50% Debt
- Risk Level 4: 70% Equity: 30% Debt
- Risk Level 5: 90% Equity: 10% Debt
Now let us assume you have Rs 1 cr to invest and a 10 year time frame. We will now project the future potential value of your portfolio based on expected returns from equity and debt and ask you to choose what you want.
For eg let us assume 12-14% return expectation for Equity and 5-7% for Debt over the next 10 years. (you can plug in your assumptions)
- 10% Equity & 90% Debt: 5-7% return expectation i.e ~ Rs 1.65 crs to 2 crs after 10 years
- 30% Equity & 70% Debt: 7-9% return expectation i.e ~ Rs 2 crs to 2.4 crs after 10 years
- 50% Equity & 50% Debt: 9-11% return expectation i.e ~ Rs 2.4 crs to 3 crs after 10 years
- 70% Equity: 30% Debt: 11-13% return expectation i.e ~Rs 3 crs to 3.6 crs after 10 years
- 90% Equity: 10% Debt: 12-14% return expectation i.e ~ Rs 3.3 crs to 4 crs after 10 years
Now what will you pick?
Obviously, the higher return version!
Think about it this way. If you are coming for a weight loss programme and I ask you – Do you want to lose 3 kgs or 5 kgs or 10 kgs or 15 kgs?

What will you answer?
Of course, 15 kgs!
The catch here is that we are being sold only on outcomes.
This is perfectly fine from a marketer’s point of view, who will vouch for the cardinal rule – ‘Never sell the process but sell the outcome’.
But the real problem lies here. Sometimes we forget that there is a corresponding effort required from our side. Higher weight loss will also mean we need to put a lot more effort – cutting junk food, eating veggies, regular workouts, better sleep etc.
Most of us recognize this ‘higher effort’ part when it comes to fitness. But when it comes to investing, we conveniently forget this!
In investing, we take the outcomes for granted. It is assumed that if you stay long term and put up with volatility you get the returns. The word “volatility” unfortunately is a little vague and understates the actual emotional pain and uncertainty that we need to go through.
Outcomes, no doubt, are an easier way to make you buy. However, understanding the actual journey and emotional pain that you will have to go through and then deciding on an asset allocation plan will ensure you stick on with the plan and realise the intended outcome!
What if we flipped the process and started with helping you understand the journey first and outcome later.
Enter the TTT Framework
The TTT Framework consists of three factors –
- Time Frame
- Tolerance to Declines
- Tradeoff
1. Time Frame
The first thing you need to know is your approximate investment time frame.
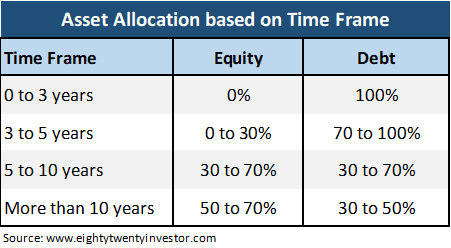
The logic is simple:
- Debt returns while they provide relatively lower returns over the long run, they are stable and consistent over the short term.
- Equity returns while they have the potential to provide higher long term returns, in shorter time frames their returns can be much lower than debt fund returns or even negative.
So as time frames increase you can have higher allocation to equity.
Why haven’t we included anything above 70% Equity Allocation?
Over the years, after dealing with several clients, we have realized that 80-100% equity allocation is extremely difficult to pull off for most of us. Unless you have experienced 2 market cycles and are fairly hands on with equity investing, we would suggest at least 30% in debt allocation.
Also when tested over the last 30 years, in the long run, a 70% Equity:30% Debt portfolio with yearly rebalancing, provides returns which is pretty close to a pure 100% equity allocation with far lower intermittent temporary declines.
In our example, you have a time frame of around 10 years and hence let us go by the bucket 5-10 years. This implies an allocation between 30% to 70% in Equities.
Now how do you decide whether it is 30% or 40% or 50% or 60% or 70% in Equities?
Phew! Too many choices and this may paralyze your decision making.
So let us simplify our choice to 30%, 50% and 70%.
2. Tolerance to Temporary Declines
Don’t get put off by the fancy jargon. In simple words, the question you need to answer is “What extent of temporary portfolio falls will you be ok with?”
While long term is fine, in real life most of us evaluate our portfolios in the short term. So unless you have a clear understanding of what is ok and what is not ok in the short term, long term returns will remain only on paper as you may panic out at the first sign of a market fall.
But what is short term?
Behavioral Scientists ask us not to monitor our portfolio too frequently as it leads to higher odds of seeing negative returns and high possibility of a knee jerk reaction.
While 1 year monitoring period would have been perfect, unfortunately, this is a tall ask as most of us find it to be too long. 3 months which is when most reviews are done is too frequent.
We think the sweet spot for portfolio evaluation is 6 months.
You can start evaluating portfolios in 6 month blocks. For eg, a 10 year period, instead of being viewed as one long term period can instead be viewed as a combination of 20 discrete 6 month short term periods.
Now all of us know that equity markets go through a lot of temporary declines.
But, what degree of MARKET FALL is supposed to be NORMAL?
The simplest way to understand this is to refer to the past behavior of equity markets.
So, we went back as long as 40+ years (from the time Sensex was launched) and decided to check for the largest fall recorded during each year i.e the fall from the highest index value to the lowest index value during a year.
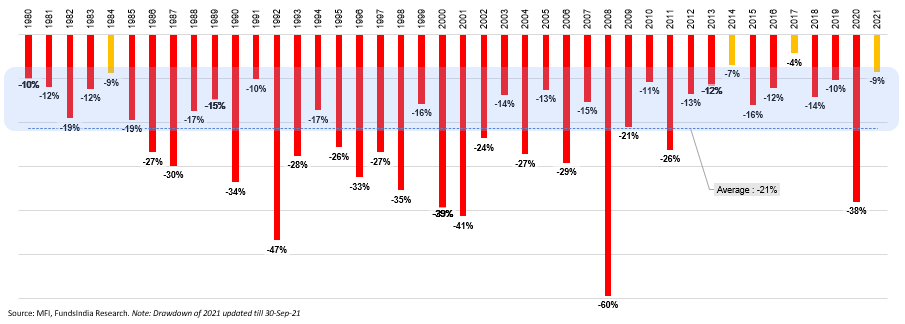
Here is what we found…
- Equity markets had a temporary fall EACH & EVERY YEAR! In fact, there was not a single year where the markets did not have a temporary decline.
- A 10-20% temporary fall was almost a given every year.
- There were only 3 out of 41 years (represented by the yellow bars) where the intra-year fall was less than 10%.
So if you have a 100% equity portfolio, a 10-20% temporary fall should be expected almost every year.
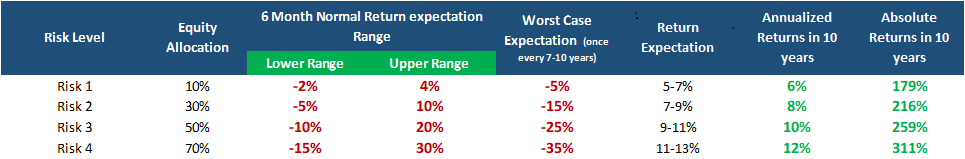
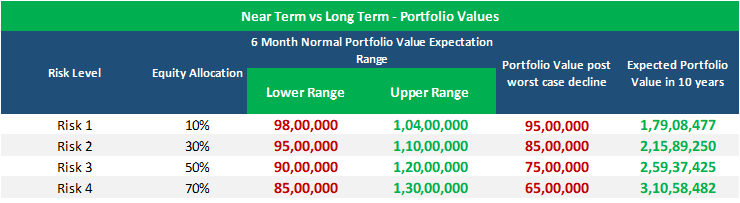
We also did a similar analysis for different asset allocation ranges and here is how it roughly looks

The above table gives you a rough range of returns that would be considered to be normal (taking the past as a guide) for different asset allocation portfolios.
For example, if you have a 70% equity allocation, 95% of the times you can expect your portfolio returns to be anywhere between -15% to 30% over the next 6 month period. You can also see that as you try and reduce your negative return range, you also end up lowering your upside as well.
To make this whole exercise more meaningful and real, let us convert this % into Rs terms..
Now for the portfolio of Rs 1 cr, let us assume you have chosen Risk 4 (70% Equity: 30% Debt).
What should be your expectation from this asset allocation choice?
- A return range of -15% to 30% in the next 6 months should be considered as normal i.e your portfolio can be anywhere in the range of Rs 85 lakhs to 1.3 crs.
- In other words, for a temporary fall of upto Rs 15 lakhs in your portfolio, you are expected to say “Nothing to worry. This is exactly what I signed up for and the portfolio is behaving as per my expectations!”
If you noticed, I had stealthily used the word “normal”. If you thought a 15% temporary fall is all that you have to tolerate for a Risk 4 asset allocation, hang on.
Here comes the killer.
Occasionally, there are also extreme temporary falls (read as bear markets) in equities of more than 30%. This can become as bad as 40-60% decline (as seen during the 2020, 2008 and 2000 market crash). While they don’t necessarily follow any pattern and can happen anytime, historically they have occurred once every 7-10 years. While we have no clue when or what will lead to the next bear market, we can be reasonably sure that we will definitely see a lot of bear markets over our investing lifetimes.
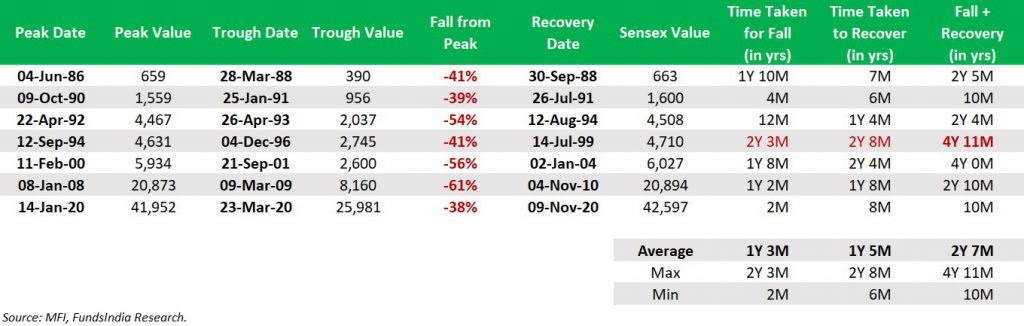
After going through 40 years of Sensex history, the highest equity fall has been around 40-60% (in the 2020, 2008 & 2000 crash). So as a part of our expectations we must also be ok with suffering a large crash once every 7-10 years.
The extent of the large but temporary decline will depend upon the equity allocation as shown below (assuming a 50% decline).
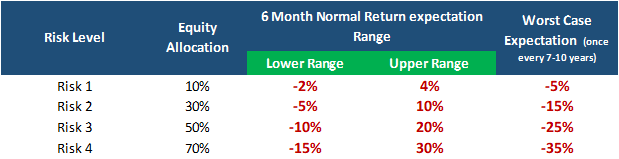
So if you choose Risk 4 portfolio, over the next 7-10 years, it is highly likely that your portfolio can temporarily go down upto 35% sometime over the next 10 years.
Percentages make it a little less scary. Let me confront you with reality…
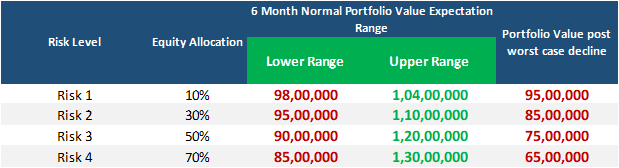
If you choose the Risk 4 portfolio and there is a large crash in the next 6 months, your portfolio can temporarily go down upto Rs 65 lakhs.
Would this be ok with you?
Like I mean, seriously, think through those values and what it would mean to you.
At this juncture, you can decide to reduce your expected declines and make your investment journey less painful by moving to Risk Level 3 or Risk Level 2.
Let us assume you have moved down to Risk 3 (i.e 50% Equity Allocation).
This will become our new expectation…
- You are comfortable with a return range of -10% to 20%, over the next 6 months and will consider this as normal behavior from the portfolio.
- This translates to a value between Rs 90 lakhs to Rs 1.2 crs.
- Also in the worst case, you are mentally ok putting up with a temporary decline of 25% or Rs 25 lakhs.
Now you have a rough estimate of your asset allocation. Let us move to the final step.
3. Trade-off between reducing short term declines and long term returns
As with everything in life, lowering the expected declines in the short term comes with a long term trade off – LOWER RETURNS!
Let us put some rough numbers to see what we stand to lose in the long term for a more comfortable short term. Assume that you expect 12% returns from equities and 6% from debt (you can plug in your own numbers based on your future return expectations).
Let us see that as actual nos…
Ah! Now it becomes clear. Our move from Risk 4 to Risk 3 may cost us roughly around Rs 50 lakhs in the future. But that’s fine. This is the cost for reducing our anxiety and sleeping well.
There is no right or wrong answer.
The simple idea is to think through the tradeoffs between short term pain and long term returns and pick an allocation which suits you.
While moving back to Risk 4 might seem tempting, the key is that you need to really introspect if you will be able to stay through the journey to enjoy the outcome. This may be the “paleo diet” version of the investment portfolio for you. Good results but damn tough to follow over the long run.
We hope you got the gist. This is how you can decide on a sensible and practical asset allocation choice.
Putting it all together
So here is how your allocation looks
Money you want to invest: Rs 1 cr
Long Term Asset Allocation: Risk Level 3 – Equity 50% + Debt 50%
Expectation (to be revised every 6 months in 1st week of January and July)
- Next 6 month Return Range which will be considered as normal behavior from your portfolio: -10% to +20% i.e the portfolio value can be anywhere between Rs 90 lakhs to 1.2 crs over the next 6 months
- Worst Case Expectation: -25% decline i.e the portfolio value can be temporarily down to Rs 75 lakhs.
Long Term Return Expectation: ~Rs 2.4 crs in 10 years and return expectation around 9% (based on assumptions Equity:12% and Debt:6%)*
Reality Check…
While you have chosen your allocation. Let me also remind you of a few other realities.
During such falls, usually it takes around 1-3 years to get back to original levels and for the entire period, your portfolio returns may look dismal. Thoughts of “I should have simply stuck to FD”, “Have I done the wrong thing” etc will haunt you and test your faith in the asset allocation that you have chosen. Several experts will call for moving from equity to debt or cash till there is clarity, and will further add fuel to your uncertainty and doubt. As the market falls, you will look more foolish with each passing day. Your hard earned money will keep going down every day.
Now it is impossible for you to imagine how this really feels and predict whether you will really be able to pull this off. Your past behavior in bear markets is the closest you can get to understand your tolerance to downside.
What did you do in Feb-Mar 2020 when the equity markets fell by ~38%?
- If you sold your entire equity allocation: You may be overestimating your tolerance levels. In this case stick close to the lower band of 30% Equities.
- If you sold a part of your equity allocation: In this case, don’t exceed 50% equity allocation.
- Held Steady or Bought more: Your chosen asset allocation is good to go!
Summing it up
Our TTT Framework
- Time Frame
- Higher the time frame higher the equity allocation
- Not more than 70% Equity Allocation
- Tolerance for Declines
- Expected Normal Declines
- Expected Worst Case Declines
- Check in actual values and not percentages
- Tradeoff between risk and returns
- Understand the long term trade off in returns
You have your Asset Allocation ready.
With this single decision you have got 80% of your investment plan sorted!
From this point on, the only thing left to do is to stick to the planned asset allocation and rebalance once every year if there is a deviation over +/-5%.
Till the next time, happy investing as always 🙂


Wonderful article, Arun. I don’t think anybody would be able to break it down so nicely for every one to understand and appreciate the asset allocation. It provides a framework to decide on the equity levels.