Where do you think the legendary investor Warren Buffett wants his money to be invested after he passes away?
In an S&P 500 Index fund.
In a letter to Berkshire Hathaway’s shareholders in 2013, Buffett said he wanted 90% of his trust money to be put in a low-cost S&P 500 Index Fund (from news reports). For long, Buffett has been a supporter of US index funds as a way for common investors to make money.
For those of you not convinced even by the Oracle of Omaha’s choices, here’s some data.
As an Indian investor, you can invest in the Sensex in the domestic market. The index constituents are large cap companies, stocks that are liquid and less volatile. But the Sensex is not your only option.
You can also consider investing in the S&P 500 index, a widely used gauge for the US equity markets. But should you?
Does it offer better returns? And what of the risk of near-term volatility?
Let’s see what the data has to say. But first a little about the index.
About the index
The S&P 500 is made up of the 500 largest publicly listed US companies accounting for 80% of the market capitalisation. A widely tracked index, it is regarded as a broad indicator of the US equity market.
It’s a large caps only- index that includes well-known companies such as Microsoft Corp., Apple Inc., Amazon.com Inc and Facebook Inc, to name a few; many of which have a global presence.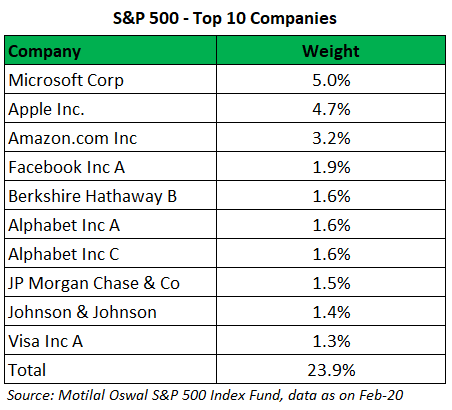
Promise of higher returns?
For our analysis, we calculate 5-year rolling returns using 32 years’ data on the Sensex and the S&P 500 TR (INR) from Jan-88 to Apr-20.
The S&P 500 TR (USD) has been converted into its rupee equivalent using the relevant USD-INR exchange rate. TR indicates total return and includes dividends (assumed to be reinvested in the index).
If history is any guide, you have a greater chance of getting higher returns (12% or even 15% plus) with the S&P 500 (INR) than with the Sensex.
Over the last 32 years, the S&P 500 (INR) gave investors an annualised 5-year return of 15% or higher 54% of the time. The Sensex did this 34% of the time. See the table for more details.
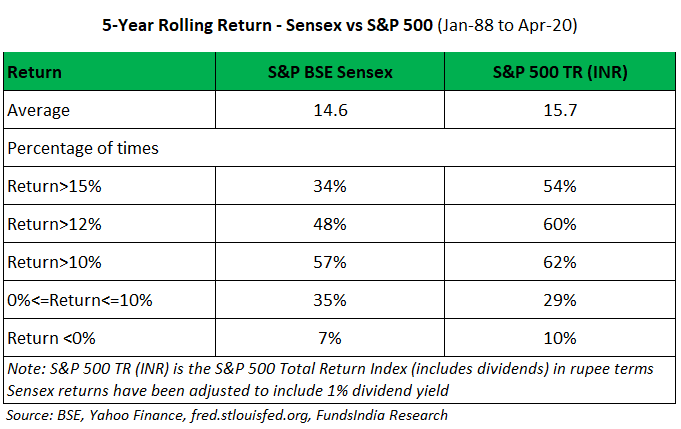
Though with the S&P 500 (INR), you also had a tad higher chance (10% versus the Sensex’s 7%) of negative returns.
That said, were the higher returns also accompanied by greater risk? That is, did investors have to bear greater short-term volatility with the S&P 500 (INR)? We try to figure this out using a few indicators.
Roller coaster ride?
Less steep maximum drawdown
We can use a maximum drawdown chart to see how the two indice have performed in the down-market years. The chart plots the fall in an index value each day relative to its peak value until that day, over a period of time.
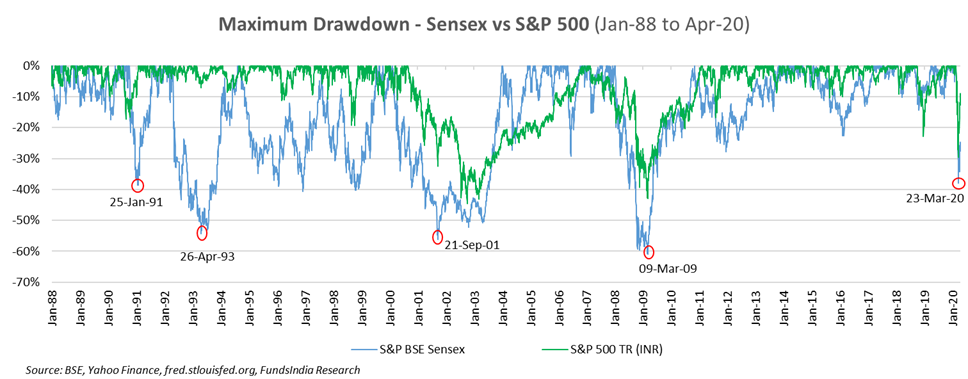
A more volatile index will have steeper drawdowns. You can see from the chart that the Sensex has been more volatile.
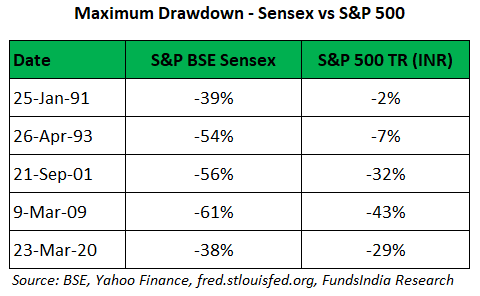
We also pick out a few cases of sharp drawdowns (market bottoms) for the Sensex. See the table below. The results are quite obvious – the Sensex falls have been steeper than those of the S&P 500 TR (INR).
Lower intra-year maximum drawdown
The difference in the volatility of the two indices comes out even more starkly if you look at the intra-year volatility charts below. The charts display the decline in an index value each day relative to the peak achieved by it in that particular year.
What do we see?
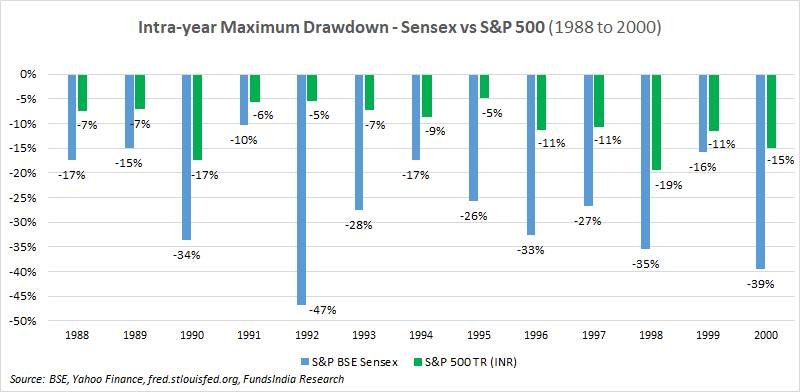

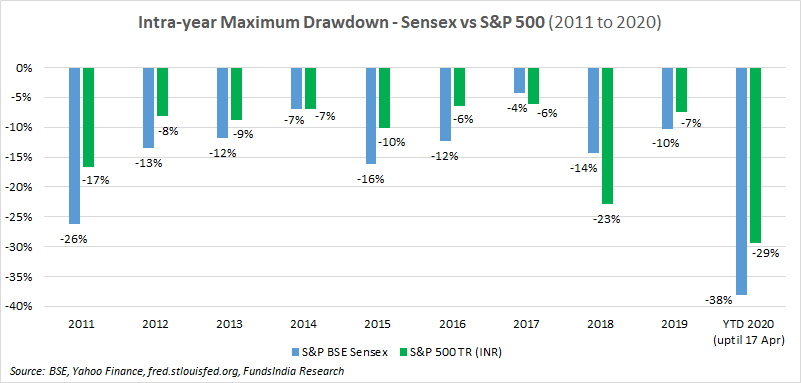
In 26 out of 33 years, the Sensex intra-year drawdown has been sharper than that of the S&P 500 (INR)!
Narrower range of six- month returns
Yet another way to gauge the extent of volatility of an index is to check the range of its 6-month returns over a period of time. Wider the range of such returns, greater the volatility. See the tables.
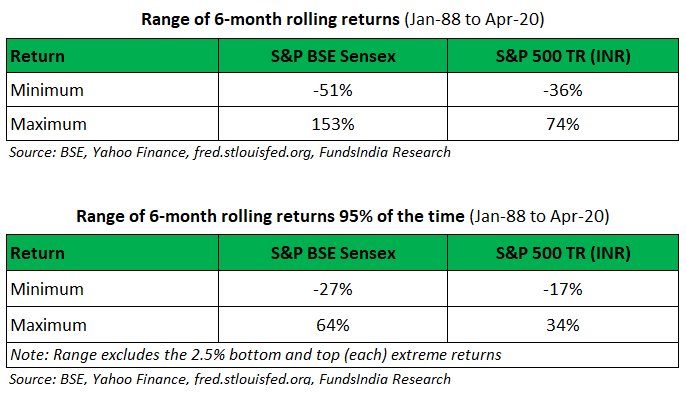
Had you invested in the Sensex, your 6-month return could have varied from -51% to as much as 151% over the last 33 years. With the S&P 500 TR (INR), your returns would have fluctuated within a narrower range, from -36% to 74%.
You could, however, argue that the return ranges are getting influenced by once-in-a-while extreme returns over the long course of 33 years. So, we refine our results by excluding the extreme returns (top and bottom 2.5% returns) for each index.
Let’s look at the second table which shows the ranges that contain 95% of the return possibilities for each index. Even after the extreme returns are excluded, the range is still wider for the Sensex than for the S&P 500 TR (INR), though both are narrower than before.
So, the S&P 500 (INR) not only holds greater possibility of higher returns, it can also do so with lower short-term volatility.
That seems like the best of both worlds. Does that mean investors should choose the S&P 500 (INR) over the Sensex?
The answer is no.
While the S&P 500 (INR) is a winner on some key counts and is therefore worth having exposure to, there is another aspect to consider too. More on this in a little while.
Diversify your risk
Investing in the S&P 500, can also help you diversify your geographical investment risk by going beyond the Indian market. This is particularly so because the S&P 500 includes many companies with global operations. Hence the diversification is not just from India to the US, but even globally to an extent.
In general, the objective of diversification is best met when you invest in assets (stock indices in our cases) whose movements are not coordinated.
Let’s see if that’s the case for the Sensex and the S&P 500. See the charts below.

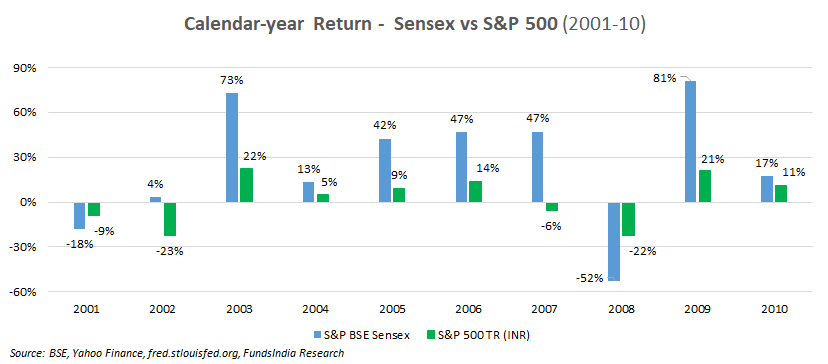
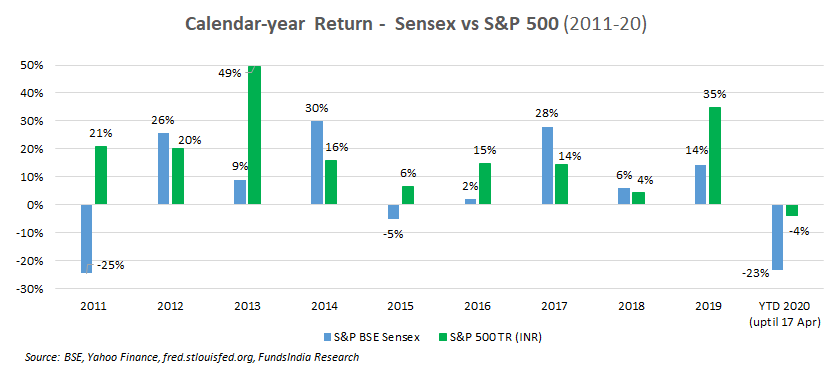
As you can see, the calendar year performance of the two indices has been very different from each other across most years. When one index has done extremely well, the other hasn’t quite so or has even ended the year down.
You can draw the same conclusion from the alpha chart too. It plots the outperformance (or alpha) of the S&P 500 TR (INR) over the Sensex. Periods of negative alpha indicate the S&P TR (INR) has underperformed.
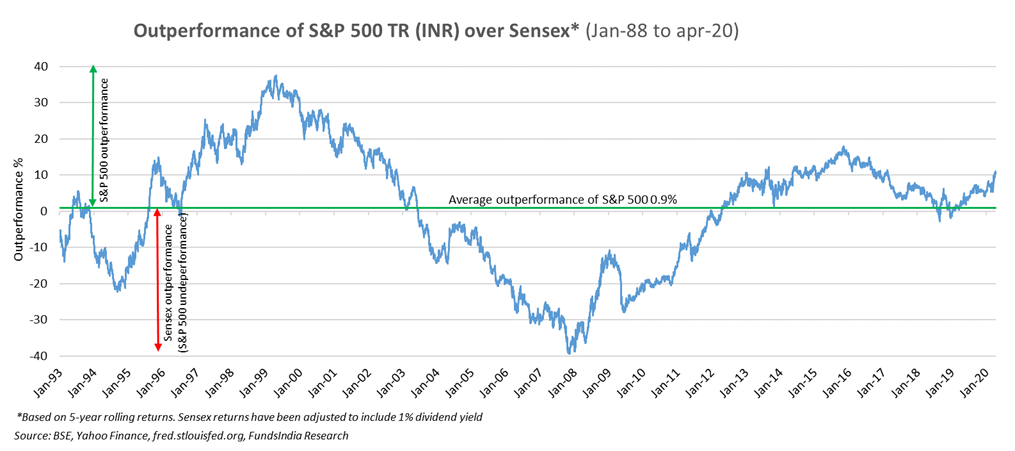
You can see there are phases of out / under performance for both the indices and neither index is a perennial winner.
By investing in the S&P 500 index, an investor can therefore mitigate his risk from investing purely in the Indian equity market. It’s for the same reason that we do not recommend investing only in the S&P 500 but in both the indices.
Gain when the rupee loses
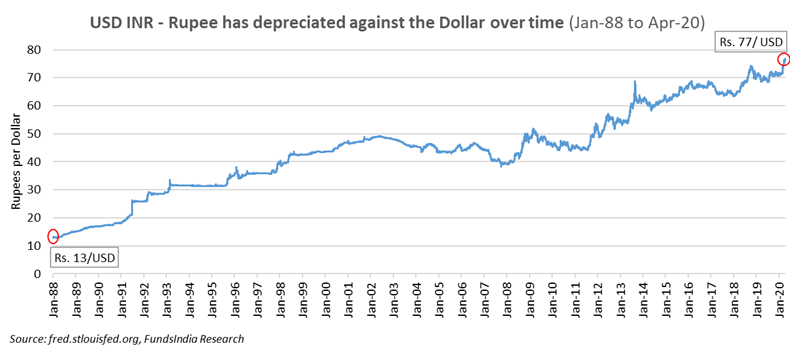
By investing in the S&P 500 index, you can also capture the benefit of rupee depreciation. When the rupee weakens relative to the dollar, you can earn a better return from the S&P 500 in rupee terms, for the same dollar return.
And while there have been a few instances of the rupee appreciating, it has depreciated against the dollar over the long-term.
During Jan-88 to Apr-20, while the S&P 500 TR (USD) grew 23-fold, the S&P 500 TR (INR) grew 136 times! This was thanks to the 6-fold depreciation in the rupee from Rs. 13 to Rs. 77 a dollar during this period.
Further, given the dollar’s safe haven and reserve currency status, long-term rupee appreciation is very unlikely. If you agree with this, you have one more reason to have some exposure to the S&P 500.
Valuations are reasonable
While we don’t recommend tactical allocation, given reasonable valuations, this is a good time to invest in the S&P 500. Data from J.P. Morgan shows that as on 31 Mar-20, the S&P 500 (USD) was trading at one-year forward P/E of 15.4 times, below its 25-year historical average of 16.33 times. Also, at 2.43%, the dividend yield was over the 25-year average of 2.07%.
What we recommend
Given the higher return potential and the lower volatility of the S&P 500 TR (INR), investors can consider putting 10-20% of their equity allocation into the S&P 500. This will also help you diversify your investment risk and gain from the rupee’s depreciation.
We recommend that you stagger this investment over the next 3-6 months instead of a one-time lump sum. This is because the US markets have already rallied from their lows in late March despite the continuing uncertainty over the Coronavirus and the lockdowns. After a sharp 29% fall on 23 Mar from its earlier peak, the S&P 500 (INR) recovered. The index was down only 9% on 17 Apr-20 from its peak.
It is difficult to say whether the markets have bottomed out or will fall further. By staggering your investment, you ensure that you do not lose out on any attractive buying opportunity in future, if the markets fall further.
Those interested in investing in the S&P 500 Index, can invest in the Motilal Oswal S&P 500 Index Fund that was launched recently.
There’s one more index, the Nasdaq 100 that you can consider investing in for exposure to the US market (specifically the technology sector). How does this index compare with the broader S&P 500 on the return-risk front? Read our next post for more information on this.


 Wealth Conversations – April 2024
- Temporary suspension of subscriptions in ” Mirae Asset Global Electric & Autonomous Vehicles ETFs Fund of Fund & Mirae Asset Global X Artificial Intelligence & Technology ETF Fund of Fund
- Merger Announcement: Aditya Birla Sun Life CRISIL IBX AAA Mar 2024 Index Fund
 Here is everything that you need to know about Arbitrage Funds
- Temporary suspension of subscriptions in “DSP US Treasury Fund of Fund”