No number crunching this week from me! We have some ready-to-crunch data offered by CRISIL-AMFI on mutual fund performance.
For all those mutual fund investment skeptics, the recently launched CRISIL-AMFI mutual fund indices’ performance will be proof enough to know that mutual funds as an investment class outperformed broad markets comfortably over the long term and also across various market phases.
The CRISIL-AMFI Mutual fund performance indices seek to track the performance of mutual funds across categories and has back-dated performance beginning April 1997. The index had 113 underlying equity schemes as of March 2013.
Wealth builders
For starters, let us explore the CRISIL-AMFI Equity fund performance index. This index delivered an annualised return of 22% in the last 16 years (ending March 2013) as against the CNX Nifty’s annual returns of 12%. Now where does that leave you in terms of building wealth? Had you invested Rs 1,000 in this equity fund index on April 1 1997, you would have had Rs 22,950 as of March 2013.
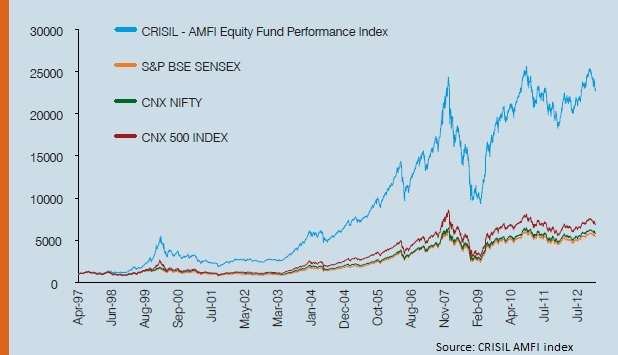
That’s about 4 times the money that the market index CNX Nifty (Rs 5,860) would have generated for you. But please note that these returns are for funds that are present in the index and not the entire category of equity funds. Also a wrong fund choice, perhaps one not present in this index, could well have also pulled down returns.
Across market phases
The index’ performance also proves that equity mutual funds have done well across bull and bear market phases. Barring the tech bubble when the excessive exposure taken by funds in the IT sector hit them badly, equity mutual funds have done well since, both in up and down markets.
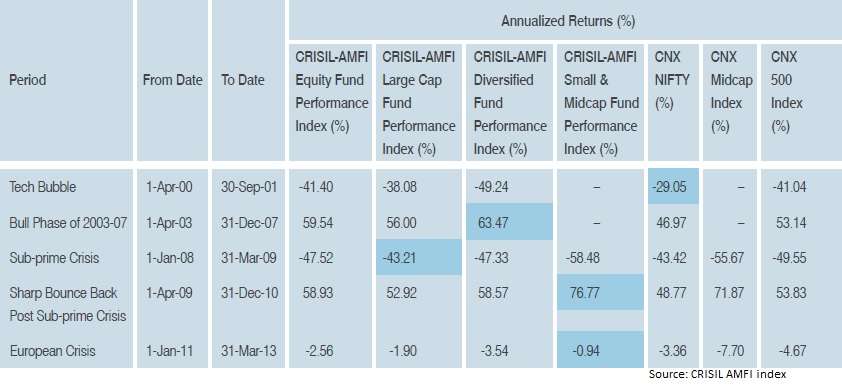
The table is evidence to the multiple options that mutual funds provide to ride the markets. While mid and small-cap funds helped capitalise the market momentum during a bounce back, large-cap funds have largely helped contain declines during falls such as the one seen during the sub-prime crisis.
Great for long term
The index’ rolling return data also points to the fact that mutual funds not only outperform in the long term but also provide consistent returns.
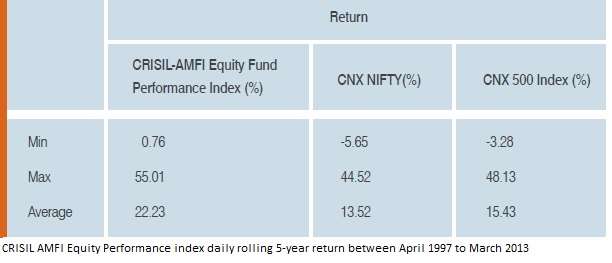
The study did a rolling five-year returns on a daily basis that revealed that the CRISIL-AMFI Equity fund index never delivered negative returns for a five-year investment horizon. That means irrespective of when you invested between April 1997 and March 2013, your returns would never have been negative. This, despite that in the said 16-year period, equity markets went through at least 3 major bear phases.
The CRISIL AMFI study has some interesting data for other categories of mutual funds as well. We will share those with you in ensuing weeks.


 Wealth Conversations – April 2024
- Temporary suspension of subscriptions in ” Mirae Asset Global Electric & Autonomous Vehicles ETFs Fund of Fund & Mirae Asset Global X Artificial Intelligence & Technology ETF Fund of Fund
- Merger Announcement: Aditya Birla Sun Life CRISIL IBX AAA Mar 2024 Index Fund
 Here is everything that you need to know about Arbitrage Funds
- Temporary suspension of subscriptions in “DSP US Treasury Fund of Fund”


the index is quite misleading.no one will say that a person invested in equity in 2007 has got any return
Hello sir, The CRISL-AMFI index is restricted to 113 funds and to that extent it may not reflect the performance of the full universe. But the data mentioned there is from 1997 not 2007.
Returns from 2007, for equity funds on an average was 5% per annum. Not high return yes, but still from the peak that return was still made possible. Also investing in any stable top-rated fund would have delivered between 8-13% annually, which is not a bad deal. Hence, while the Sensex may be below its 2007 highs, mutual funds as a category are not. Thanks, Vidya
Post mortems are of no use. This is a misleading article.
Future returns are in no way reflected in past analysis.
If you say equity funds will do well 2013-2026, because they did well 1997-2013, that is wrong.
Hello Vijayan, Post mortems are as important as forecasts. The report is evidence to the fact that mutual funds outperformed the market. This does exude confidence for people as it tells if markets do perform well, funds can do better. If markets fall, the funds will at least contain falls. As for fund forecasts, it is something entirely dependent on markets and economy. If markets and economy fail, clearly funds can’t deliver superlative returns; it is the case with every market-linked product. The report helps an individual to know that equity funds can be ideal products to ride the market. That would be true of the ups as well as downs.
Tks
Vidya
What about Survivorship bias and all of those funds that went bust or were discontinued. This finding based on 113 funds only is misleading and it will help if you could conduct the same analysis with all funds that existed since 1997.
Hello Mandar,
Survivorship bias, to a certain extent, is a valid criticism. However, please note that this study is trying to figure out if mutual fund schemes had an impact in people’s investment returns, not to see if any mutual fund scheme would have given great returns. In that way, using asset weighted average is a proper, well-accepted way of doing this. That is to say, money went to good funds for the most part and here is how they performed. True, some funds were terrible, but as in any free market, such funds did not garner much assets and due to that, their impact on real investor portfolios were reduced.
thanks,
Srikanth
1] It is no doubt that a bunch of MF have given fabulous returns. But today no one can predict which are the ones that shall be the best in next 10-15 years.
2] Top 200 stocks are almost 85-50% of mkt cap and all funds are invested there only. The total mkt cap has gone up and who has made money – (Smart guys or MF investors or retail)
Of course sum total can not be greater than the mkt cap diif in 2012 and 1997 – so there lies the answer, SURVIVORSHIP bias is the reason for the SUCCESS STORY reflecting in the above article.
If you can throw light on the no of schemes in 1997-98 and the ones surviving till date the actual returns shall be seen.
Hello Piyush, thanks for your comments. Your point on survivorship bias is well taken. If we take equity fund returns from 1999 till date (15 years), you wills see that all of them (except one JM fund) delivered double digit returns – proof to the fact that equity investing delivers. Of about 28 schemes 25 delivered over 15% compounded annually and are still mostly in the top 1 and II quartile of more recent (3,5 year) performance charts. A few of them slipped of course but it is not a bad picture at all.
But agree that there is change in the performer list over time. For instance, while Reliance Growth and Vision will appear in the top 10 in the 15-year chart, it is not the case with 5-year list. This is why it becomes inevitable for investors to review (or get their advisors to review) the fund performance and make changes, if required. thanks, Vidya
the index is quite misleading.no one will say that a person invested in equity in 2007 has got any return
Hello sir, The CRISL-AMFI index is restricted to 113 funds and to that extent it may not reflect the performance of the full universe. But the data mentioned there is from 1997 not 2007.
Returns from 2007, for equity funds on an average was 5% per annum. Not high return yes, but still from the peak that return was still made possible. Also investing in any stable top-rated fund would have delivered between 8-13% annually, which is not a bad deal. Hence, while the Sensex may be below its 2007 highs, mutual funds as a category are not. Thanks, Vidya
What about Survivorship bias and all of those funds that went bust or were discontinued. This finding based on 113 funds only is misleading and it will help if you could conduct the same analysis with all funds that existed since 1997.
Hello Mandar,
Survivorship bias, to a certain extent, is a valid criticism. However, please note that this study is trying to figure out if mutual fund schemes had an impact in people’s investment returns, not to see if any mutual fund scheme would have given great returns. In that way, using asset weighted average is a proper, well-accepted way of doing this. That is to say, money went to good funds for the most part and here is how they performed. True, some funds were terrible, but as in any free market, such funds did not garner much assets and due to that, their impact on real investor portfolios were reduced.
thanks,
Srikanth
Post mortems are of no use. This is a misleading article.
Future returns are in no way reflected in past analysis.
If you say equity funds will do well 2013-2026, because they did well 1997-2013, that is wrong.
Hello Vijayan, Post mortems are as important as forecasts. The report is evidence to the fact that mutual funds outperformed the market. This does exude confidence for people as it tells if markets do perform well, funds can do better. If markets fall, the funds will at least contain falls. As for fund forecasts, it is something entirely dependent on markets and economy. If markets and economy fail, clearly funds can’t deliver superlative returns; it is the case with every market-linked product. The report helps an individual to know that equity funds can be ideal products to ride the market. That would be true of the ups as well as downs.
Tks
Vidya