When we analyse funds, rolling return is one of the key metrics we look at. You would have noticed it in most of our fund reviews and recommendations. Read on to know what rolling return is, how to use it, and why it’s so important.
Fund returns
Websites and factsheets that present return figures provide the 1-year, 3-year, 5-year, since inception, returns etc. Here’s the important point to note about these figures – it is the return from a single date to a single date (referred to as point to point returns). It is the return of the fund in the given time frame as on that date. For instance, the 1-year return number on 1st of January, 2017, gives the fund’s performance in the year 2016. It shows the returns of a fund from one point in time (1st January 2016) to another point in time (1st January 2017).
Looking at returns only on a single day gives a limited view of the fund’s performance. Take equity funds. A few stocks in the portfolio can suddenly rise or dive in a matter of days or weeks. This causes the NAV for a particular day or for a few days to quickly shoot higher or fall. Taking that day’s NAV and then the NAV a year ago then calculate 1-year returns and then draw a conclusion about that fund’s performance would not be possible.
For example, several funds hold Infosys. Those that have a heavy exposure of 7-9% may have seen their NAVs fall sharply in the wake of the stock’s swift decline last week. This suddenly low NAV on the base of the NAV a year ago can compress the 1-year return. Does that mean it’s a bad fund? Of course not!
For a fund to be counted as good, the trend of identifying correct stocks has to be sustained. That’s where we use rolling returns. Secondly, what are the chances that you invested in that fund on that day? Your fortunes may have been different (entirely due to market behaviour) had you invested on January 1, 2009, compared with January 1, 2008. Point-to-point returns show different returns based on when you were invested. What you really need to know is what would have been the return of a fund had you invested on any day in the market. Rolling returns will help you assess this.
Breaking down Rolling Return
Rolling returns are returns taken over a continuous period of time. That is, a particular period of returns is taken at regular intervals over a period of time. For example, you can take 1-year returns every month for 3 years. This will tell you how 1-year returns have moved.
Or let’s say you want to look at 3-year rolling returns for a fund daily over the years from 2012 to 2016. You will essentially be taking the 3-year return for the fund on each day falling in the period from 2012 to 2016. You will get a series of 3-year returns as on each date for the entire 5 years.
This will be called rolling 3-year returns, rolled daily over 5 years (you could take a longer period of 7 years or 10 years). This can be broken down into three components:
-
Part 1 – “rolling 3-year return” – This refers to the duration for which the returns are being considered. This example is taking 3-year returns. It can be any duration – 1-year, 5 years, 6-months, 1 day.
-
Part 2 – “rolled daily” – This part is the frequency or how often the returns are being looked at. Part 1 and 2 together mean that you’re looking at 3-year returns every single day. The returns do not necessarily have to be rolled on a daily basis. Returns can be rolled on a weekly or even monthly basis. However, rolling returns with lower frequency are less useful.
-
Part 3 – “over 5 years” – this is the time period over which the returns are rolled. In our example, the three parts together mean that we’re looking at 3-year returns, every single day, for 5 years. This will give you approximately 1260 data points. If you look at 3-year rolling return, rolled weekly for 5 years, it is likely to give you around 260 data points.
How to calculate Rolling Returns
Calculating rolling return yourself is doable, if a bit tedious. You need the entire NAV history of a fund first. Head over to any AMC’s website and download the NAV history of a fund into a spreadsheet.
Let’s continue with our 3-year rolling return example. You’d need the NAV history for 8 years (as the start date itself needs a 3-year return and our period under consideration is 5 years). In the downloaded data, look at the start date. Our example’s start date is 1st January 2009. Scroll down to a date 3 years from the start date which will be 1st January 2012. Then calculate the annualised return between these two dates. That is:
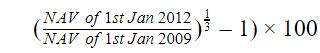
Now copy this formula for every day till 31st December 2016. Each of the cells so filled would show the 3-year return as on the corresponding date in the row.
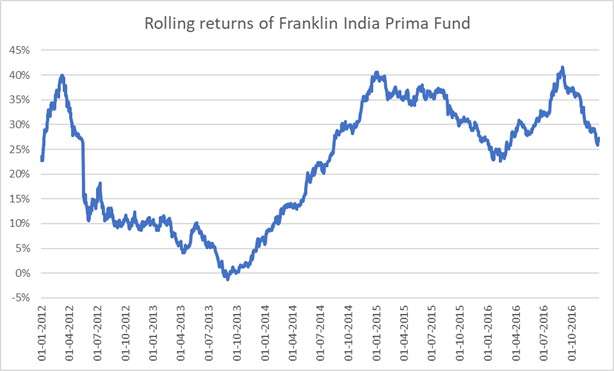
This is a plot of rolling returns for Franklin India Prima Fund:
How to use Rolling returns
Now that you know how to calculate rolling returns, it is time to understand what you can do with it.
-
Take the average – The average of the rolling returns gives a better representation of the fund’s performance compared to the point to point returns, since it covers different market situations over the years.
Consider this. As on 1st January 2015, the 3-year return of Franklin India Prima fund was an annualised 40.55%. On the same date, the average of last 3 years’ rolling return was an annualised 15.56%. This is because in January 2015 stock markets were still in the boom that began in 2014. The base date of 2012 was just after the markets corrected in 2011. So you had returns from a single low point to a single high point. It ignores the uptick in 2012 and the correction in 2013. As on 2nd September 2013, a date in between the above time period, the 3-year return of the fund was -0.63% p.a. Looking at the point to point returns gives the impression that the fund is either a poor loss-making one or one that has always given high returns during the 3-year period. Neither is correct. The average rolling return covers all the markets ups and downs and thus gives a more realistic return number. -
Compare it to the benchmark – The benchmark index number can be downloaded from NSE or BSE website. Place the numbers beside the fund NAVs. Make sure the dates correspond to each other. Now calculate rolling returns for the index and compare. It tells you the number of times the fund has outperformed the index. You can also calculate the average margin of outperformance.
For instance, during the period of 2012-2016, Franklin India Prima fund has beaten the benchmark 99.7% of the times, based on rolling 3-year returns. The average margin of outperformance was 9.81% p.a.
Rolling return figures can be used for other calculations such as risk-adjusted returns, volatility, and the like. But these figures need to be compared across funds and it can get extremely tedious for you to do on your own. Therefore, using it to check for consistency and to prevent being influenced by the 1-3-5 year returns is a good way for you to use it.


 Wealth Conversations – April 2024
- Temporary suspension of subscriptions in ” Mirae Asset Global Electric & Autonomous Vehicles ETFs Fund of Fund & Mirae Asset Global X Artificial Intelligence & Technology ETF Fund of Fund
- Merger Announcement: Aditya Birla Sun Life CRISIL IBX AAA Mar 2024 Index Fund
 Here is everything that you need to know about Arbitrage Funds
- Temporary suspension of subscriptions in “DSP US Treasury Fund of Fund”


How to Calculate Rolling Returns of a Mutual Fund SIP. How to consider Holidays in NAV Data. Should we skip it or enter those Dates and put zero/previous day’s NAV.
I had asked a Question here when i came across this article earlier which is still not posted. I wanted to know that while calculating the rolling returns; only the Business Days are to be considered? Whether a particular date should be matched with that of the next year i.e. 1 jan 2017 with 1 jan 2018? If not then what values should be used for a Non Business Day?
Rolling returns are calculated by comparing the NAVs on corresponding dates. so, for 1 year rolling return, 1st Jan 2018 NAV will be compared to 1st Jan 2017 NAV, 2nd Jan 2018 to 2nd Jan 2017 and so on. If the NAV for any particular day is not available for comparison, we use the NAV of the prior day.
How to Calculate Rolling Returns of a Mutual Fund SIP. How to consider Holidays in NAV Data. Should we skip it or enter those Dates and put zero/previous day’s NAV.