MACD or the Moving Average Convergence-Divergence is one of the most popular indicators used by a technical analyst. It is one of the simplest and effective tools among the myriad of technical indicators that is available.
Simply put, the MACD indicator is nothing but the difference between two exponential moving averages.
The MACD has two components – the MACD line and a Signal Line. The MACD line is the difference between the 12-day exponential moving average and the 26-day exponential moving average. The Signal line is a 9-day exponential moving average of the MACD line.
These are the default settings as prescribed by its inventor – Gerald Appel. There is no hard and fast rule about these settings and you can experiment with any two sets of moving averages.
The key point to remember is that the MACD works well when the price is in a strong trending mode. This tool would produce a lot of whipsaws when the price is in a sideways or non-trending mode. As is the case with any technical analysis tool, use the MACD indicator to look for buying opportunities in an uptrend and selling opportunities in a downtrend.
Remember that a buy / sell signal in the MACD is always triggered before a big move, but not all signals in the MACD would lead to a big trending move.
The buy signal happens is triggered when the MACD Line moves above its trigger line and a sell signal is triggered when the MACD line crosses below its trigger line.
There is a ton of material available online about MACD but we would like to highlight an interesting use which is called the Hook-up pattern, a term coined by analyst at www.elliottwave.com. Before discussing the details, please be reminded that this pattern works well when the price is in a strong trending mode.
When there is a strong trend in place, the chances are slim that you will get a secondary entry to participate or ride the trend. Typically, the MACD line would moving farther away from its Trigger line in a strong trending mode. It is in this context that the Hook-up pattern comes in handy to participate in the trend.
In a strong trend, when the price takes a breather in the form of a sideways or counter-trend pullback move, the MACD Line would dip closer to its trigger line and then resume its move in the direction of the underlying trend. A trade decision may be taken when the MACD line resumes its move in alignment with the underlying trend. This is more easily identified when you plot the MACD in a histogram mode.
If you plot the MACD indicator as a histogram, the height of the histogram would diminish during a counter-trend pull-back or correction and then turn up / down as the price resumes its trend. A buy or sell decision may be considered when the height histogram is higher than its previous day.
Let’s discuss this with a practical example. Here is daily chart of Gujarat Alkalies with the MACD indicator plotted below. The red line is the MACD line and the blue one is the Trigger line. The magenta colored histogram represents the difference between the MACD line and its trigger line.
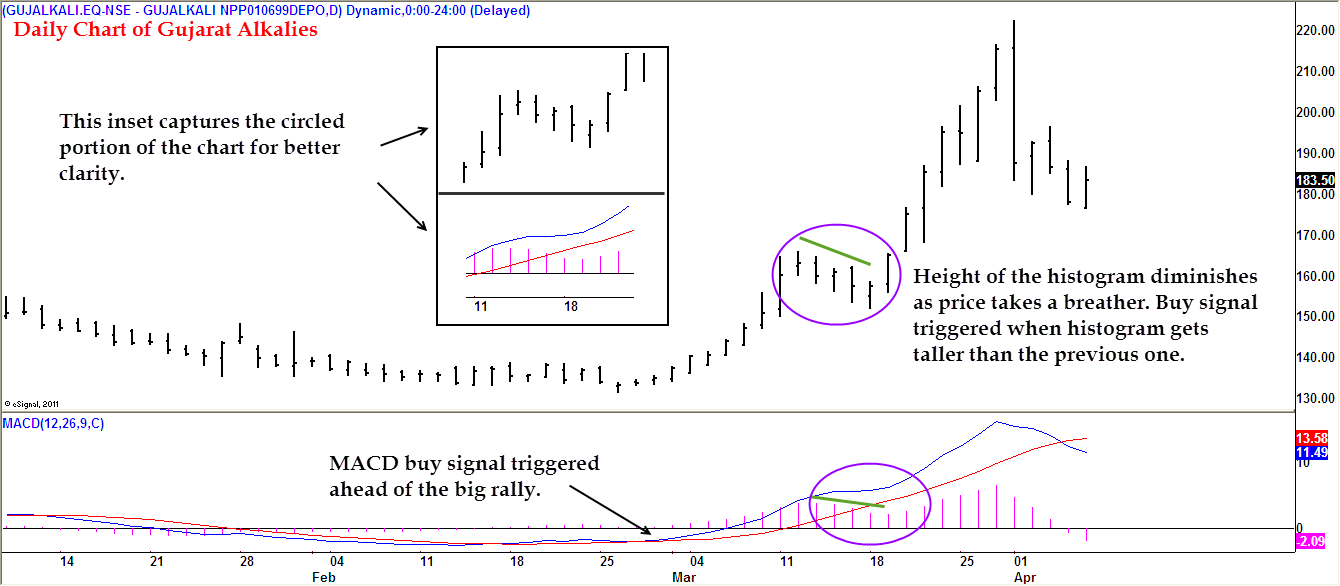
It is apparent that the stock has been in a strong uptrend and notice how the MACD buy signal was triggered before the sharp rally. There was a secondary buying opportunity using the Hook-up pattern, as highlighted in the chart. Notice how the height of histogram dropped while the price was taking a minor breather. Also notice how the height of the histogram increased when the price resumed its uptrend. A buy signal would be triggered when the height of the histogram was taller than the previous day. This happened on March 19 and a long trade initiated on March 20 would have been profitable.
Remember that we are talking about just one aspect of trading here, which is the entry. The other aspects such as stop loss and targets are equally important. Tools such as moving average and fibonacci retracement may be used to address the stop loss and target aspects of the trade.
The intention here is to highlight a simple and effective way to use the MACD indicator. Next week, we will follow-up with a few more examples of this pattern.
Trade Safe and Don’t Get Hurt.


 Wealth Conversations – April 2024
- Temporary suspension of subscriptions in ” Mirae Asset Global Electric & Autonomous Vehicles ETFs Fund of Fund & Mirae Asset Global X Artificial Intelligence & Technology ETF Fund of Fund
- Merger Announcement: Aditya Birla Sun Life CRISIL IBX AAA Mar 2024 Index Fund
 Here is everything that you need to know about Arbitrage Funds
- Temporary suspension of subscriptions in “DSP US Treasury Fund of Fund”


BK, as you have rightly mentioned that MACD will work in a trending market and not a range bound one. I have 2 questions:
1. So what is its advantage over other indicators or a MA crossover?
2. What works in a range bound markets and what are the signs of a range bound market?
Rgds
Hi Anish,
In a trending market, any tool works well as long as it gives a buy signal in an uptrend and sell signal in a downtrend. Given this context, you can use MA crossover as well instead of MACD. Doesn’t really matter.
The difference basically would be in terms of getting a signal early or a bit delayed. So, use any tool that you are comfortable with and use it in sync with the primary trend.
Regarding your second question, the best thing to do in a rangebound and non-trending market is to step aside and do nothing. The easiest way to identify a rangebound market is when you get whipsawed often.
The more logical way to identify a rangebound market when the price fails to progress in a sequence of higher tops and bottoms or lower tops and bottoms. Typically, the moving averages would turn sideways and you can also use the ADX indicator to get a handle on the trendiness of the market.
Hope this helps. IF not, Please drop a line.
Best
B.Krishnakumar
Tks BK. This was was helpful.