Last week, we discussed the MACD indicator and also highlighted the Hook-Up pattern. Let’s take the discussion forward and look at a couple of more examples that highlight this concept. Featured below is the daily chart of Steel Authority of India.
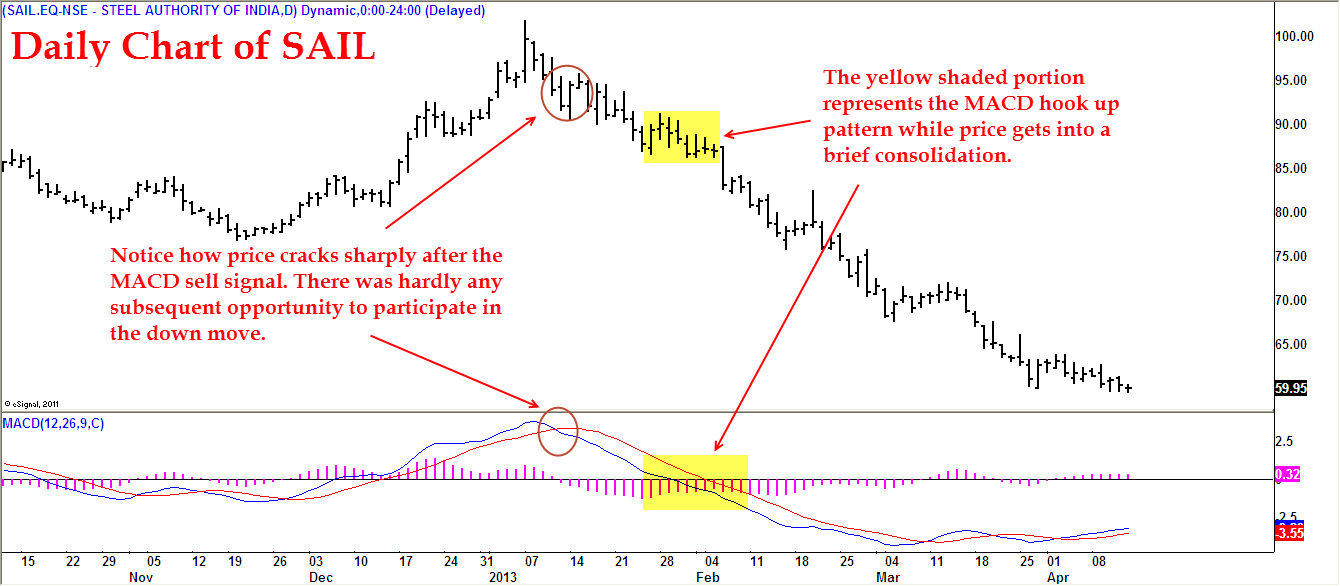
Notice how the price has been in a sustained downtrend with the momentum picking up. After the MACD sell signal triggered on Jan.7, the stock cracked sharply and note how the fall has been relentless. There was hardly any opportunity to get on board to ride this downtrend. The setting is therefore perfect to use the Hook-Up pattern.
Kindly direct your attention to the diminution in the height of the MACD histogram since Jan. 25 to Feb. 5 as price took a breather. On Feb.6, the value of the MACD histogram was higher than the previous day, which sets up the trigger to consider short position. If you recall from last week’s discussion, MACD hooks up when the price resumes its prior trend.
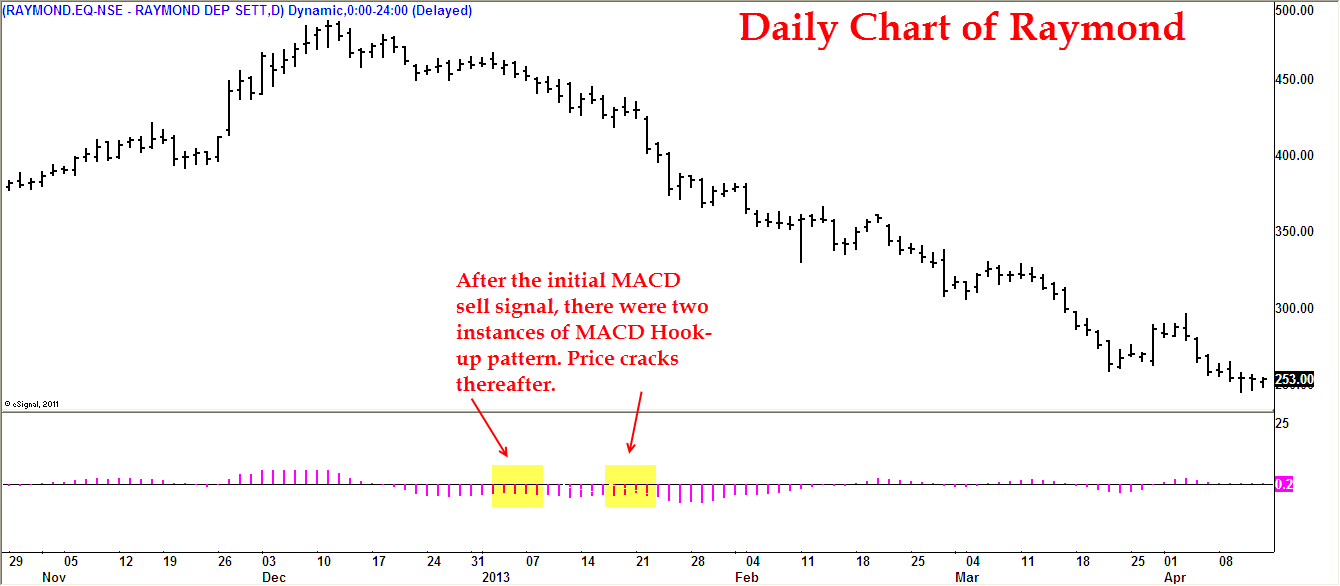
The same concept is highlighted in the daily chart of Raymond featured below. The MACD histogram alone is featured below and the MACD lines are masked for better visibility.
Next week, we will address the Relative Strength Index along with the various kind of divergence that is associated with it. Until then Trade Safe and Don’t get Hurt.


 Wealth Conversations – April 2024
- Temporary suspension of subscriptions in ” Mirae Asset Global Electric & Autonomous Vehicles ETFs Fund of Fund & Mirae Asset Global X Artificial Intelligence & Technology ETF Fund of Fund
- Merger Announcement: Aditya Birla Sun Life CRISIL IBX AAA Mar 2024 Index Fund
 Here is everything that you need to know about Arbitrage Funds
- Temporary suspension of subscriptions in “DSP US Treasury Fund of Fund”