Globally, as a majority of the actively-managed funds have been underperforming their benchmark indices for a long time, investor money has been flowing into low-cost passive (or index) funds.
In India, while the money managed by index funds pales in comparison with that handled by actively-managed funds, they have been gaining in popularity. They are gradually emerging as a cost effective alternative especially in the large cap segment.
Shrinking advantage
This is for several widely known reasons. Following the SEBI re-categorisation norms of Oct-17, large cap funds have been mandated to invest at least 80% of their corpus in large cap stocks (top 100 stocks by market cap).
Earlier funds had the leeway to, and actually did invest across a wider universe of stocks. With the changed rules requiring these funds to invest 80% of their corpus only in the top 100 stocks, their ability to generate benchmark-beating returns has been impacted
These top stocks are the most widely tracked and researched ones, leaving no lesser known/ hidden opportunities to be exploited by fund managers to generate superior returns. The SEBI re-categorization leaves them with only up to 20% to be invested outside of the large cap space.
That apart, actively-managed funds have higher expense ratios which unless backed by better returns, may not make sense for investors.
Many large cap funds have expense ratios ranging from 1.7% to 2% for regular plans. On the other hand, index funds (almost all track large cap indices) are cheaper with expense ratios of 0.3% to just under 1%.
At the very least, large cap funds will have to make an additional return of 1-1.5% over index funds just to catch up with them. To outperform them comfortably post expenses, will require at least another 2%. And that is no mean task after SEBI’s re-categorisation norms.
Down but not out
Do note though, large cap funds may have one more leg of outperformance as polarisation comes to an end. A dominant trend in the Indian stock market since 2018 has been polarisation where market returns have been driven by a handful of top stocks while the vast majority of them have languished.
There are however, initial signs of narrowing down of this polarisation in large caps (indicated by the line graph segment after the red dot). See the chart below.
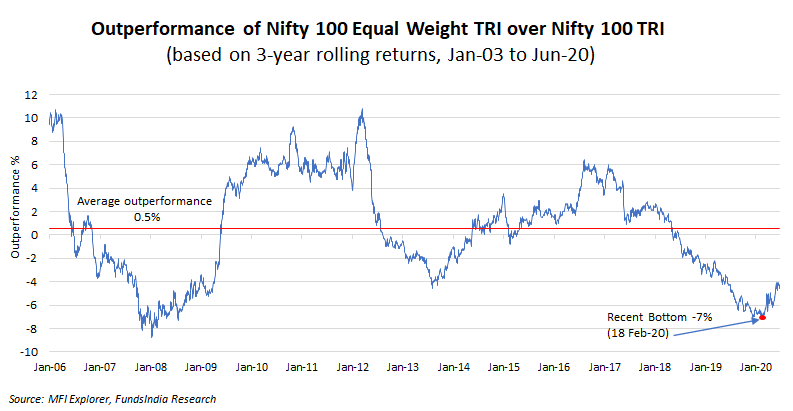
The constituent stocks are assigned equal weights in the Nifty 100 Equal Weight Index while these same stocks are assigned weights based on their market cap in the Nifty 100 Index.
Whenever the Nifty 100 Equal Weight underperforms the Nifty 100 (shown by parts of the line graph under 0%), it indicates polarisation. That’s because when only a few larger stocks are rising as is the case under polarisation, then the Nifty 100 Equal Weight Index which assigns equal weights to all stocks (including the underperformers) lags behind the Nifty 100 Index.
Once this polarisation ends and the performance becomes more broad-based across stocks, large cap funds (most of which are well-diversified) can see an uptick in performance in the coming 1-3 years. For more details on this, read our earlier blog Large Cap Funds – It ain’t over till it’s over
Further, a likely mean reversion in the recent underperformance of midcap stocks (constitute up to 20% of large cap fund portfolio) too could help fund’s perform better over the next few years. Historically, midcaps have outperformed large caps by 2% points on average over the long-run.
But beyond 3 years, investors can consider investing in index funds instead of actively-managed funds for long-term exposure to large caps.
What options do such investors have in the index fund space?
The most obvious choice is to go for a Nifty 50 Index Fund. Another option can be a Nifty Next 50 Index Fund. The Nifty Next 50, as the name suggests represents the next 50 largest companies (by market cap) after the Nifty 50 companies.
Alternatively, you can also consider splitting your large cap space allocation 50-50 between these two indices.
For our analysis we have used rolling returns based on nearly 25 years’ data (beginning Oct-95) on the Nifty 50 and the Nifty Next 50.
Returns matter
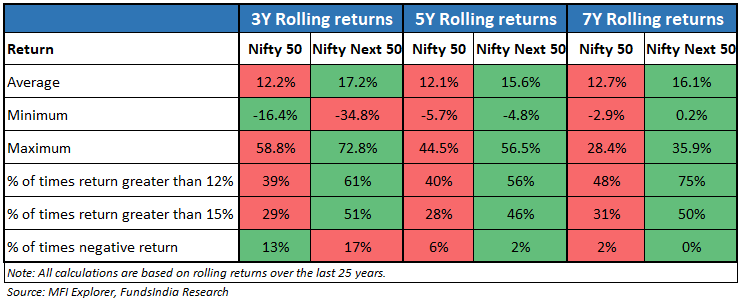
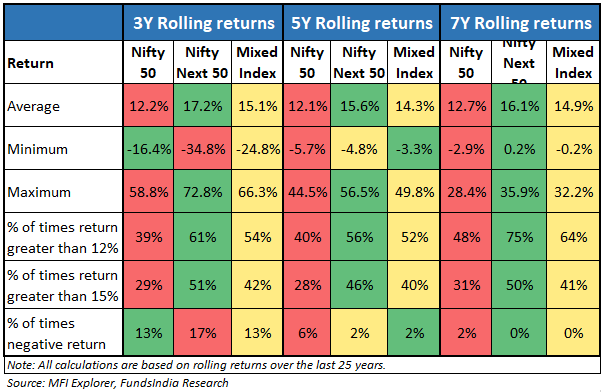
If we go simply by returns, the Nifty Next 50 is a clear outperformer across all periods – 3, 5 and 7 years. The index has returned an average 17.2% (vs 12.2% for Nifty 50), 15.6% (vs 12.1% for Nifty 50) and 16.1% (vs 12.7% for Nifty 50) respectively over these periods. See the table below.
But, you can always argue that averages can be misleading.
So, we approach the question of performance by checking which index has given investors certain levels of reasonable returns. We assume 12% and 15% to be such levels.
Going by this metric too, the Nifty Next 50 turns out to be the outperformer. Over the last 25 years, the index gave a 3-year return (annualised) of 12% plus, 61% of the time, far more frequently than the Nifty 50 which did it 39% of the time. And that’s not all. If you look at longer periods – 5 or 7 years – then the Nifty Next 50 has also had fewer instances of negative returns compared to the Nifty 50.
So far all good. But, that leaves one more part to consider.
For where there’s return, there’s also risk.
What must investors be prepared to experience in the interim if they ultimately want to experience higher long-term returns? And what if an investor is not ready to bear this interim ‘cost’?
Let’s answer the first question. Volatility is what investors must be ready to bear with.
Gauging volatility
We use capture ratios, maximum drawdown, intra-year drawdowns and 6-month return volatility for this purpose.
Capturing more downside
Capture ratios provide a snapshot view of the extent of an index’s fall and rise when the broader markets fall and rise respectively.
A downside capture ratio of 109% (greater than 100%) for the Nifty Next 50 implies that the index has fallen more than the Nifty 50 (or has captured more of the downside) in periods when the markets fell.
Though do note, the Nifty Next 50 index has also captured more of the upside in periods when the markets rose. This is indicated by an upside capture ratio of 116% (greater than 100%) for the Nifty Next 50.
Steeper maximum drawdowns
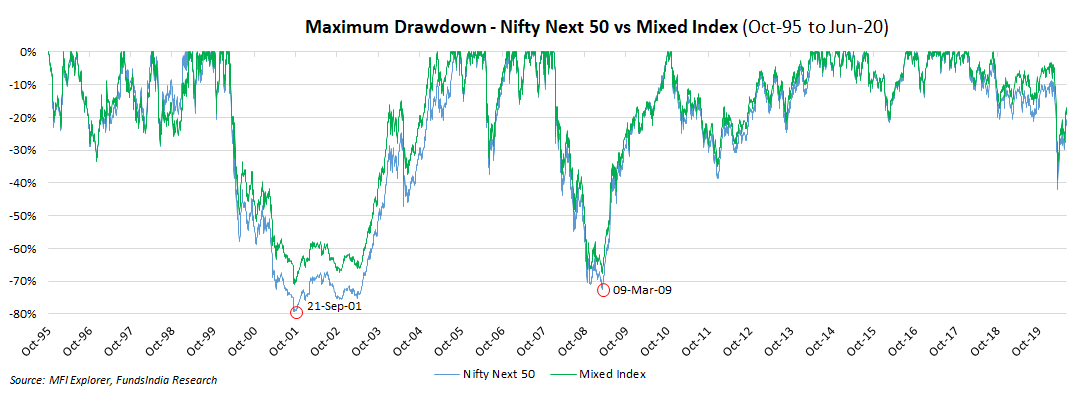
Next, we look at the Maximum Drawdown Chart (below) which shows how the indices have fared, particularly in the down-years.
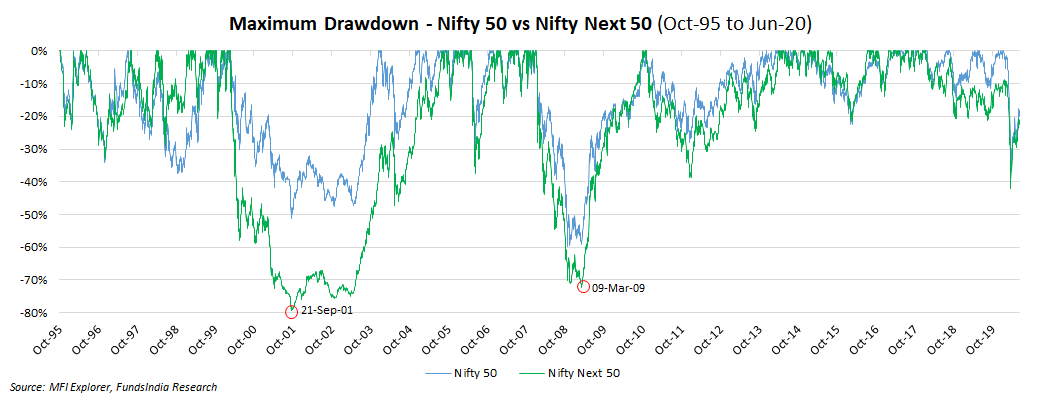
The chart plots the daily returns for the Nifty 50 and the Nifty Next 50 indices. It shows the extent of fall in each index each day compared to its previous peak until then. As the chart shows, the Nifty Next 50 has fallen more than the Nifty 50 several times.
This is particularly evident on some of the sharpest market bottoms. Take 21 Sep-01 (following the September 11 U.S. attack) – when the Nifty 50 fell by 51% and the Nifty Next 50 by 79%. The Nifty Next 50 would need to rise by 376% simply to get back to its pre-fall level! The Nifty 50 would have to go up by only 104%.
Similarly on 9-Mar-09, which was the Subprime Crisis market bottom, the Nifty 50 declined by 59% and the Nifty Next 50 by 72%. Once again the latter would need to rise far more to recoup the loss and recover to its old level.
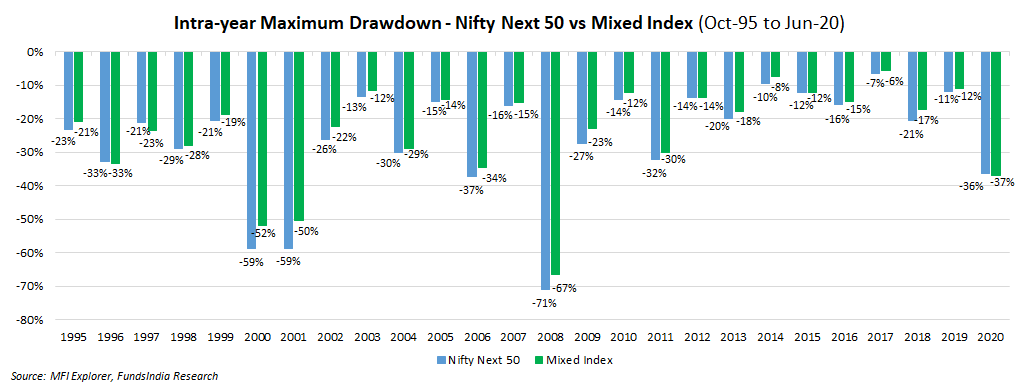
Higher intra-year volatility
To get a more precise picture, we also look at the intra-year drawdowns. The chart plots the sharpest daily declines (with respect to the peak in that particular year) for each index every year.
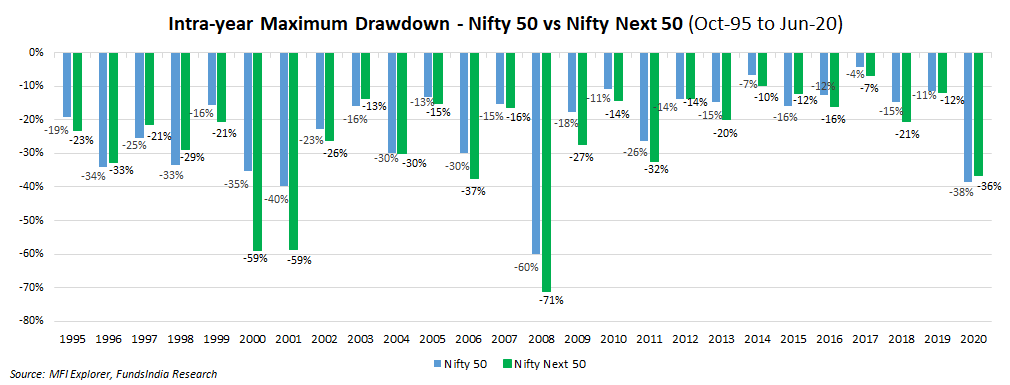
You can see that in 19 out of 25 years, the Nifty Next 50 has fallen more than the Nifty 50.
Wider range of 6-month returns
Further, as an investor while we may invest for the long-run, we may also like to track our short-term returns. If that’s the case, it’s worth checking what one can expect in the short run.
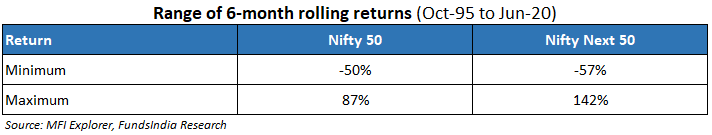
For this we look at the range of 6-month returns for the two indices over the last 25 years. Wider the range, greater the volatility.
Had you invested in the Nifty Next 50, your 6-month return could have varied from -57% to as much as 142%. With the Nifty 50, your returns would have fluctuated within a narrower range of -50% to 87%. See the table below.
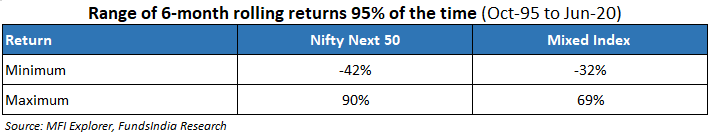
The difference in the volatility of the two indices comes out more sharply once we exclude the once-in-a-while extreme returns (top and bottom 2.5% returns) and focus only on the 95% of the return possibilities. See the table.
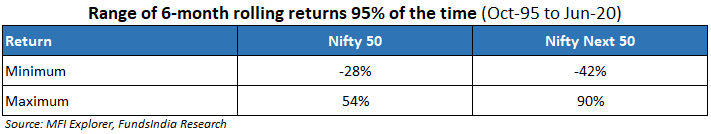
Once the extreme returns are excluded, the 6-month range becomes significantly wider for the Nifty Next 50 than for the Nifty 50.
So, while the Nifty Next 50 holds the possibility of higher returns, it also comes with greater short-term volatility as gauged from several factors. If you are prepared to experience a wider range of returns in the short run, you can consider investing in a Nifty Next 50 Index Fund.
Another risk factor to check for are index valuations. At the moment, the Nifty Next 50 is trading at a premium both with reference to its historical valuations, and also compared to the Nifty 50 which is currently close to its historical levels.
For those concerned with too much volatility, the Nifty Next 50 is not really an ideal choice.
What are the options for conservative investors?
They can simply invest in the Nifty 50. This is for ultra-conservative investors who want the least volatile index.
Another better alternative however, can be a 50-50 allocation between the Nifty 50 and the Nifty Next 50 Index. To evaluate the returns and volatility of this option, we have constructed what we call a Mixed Index which is simply an index constructed to capture the said parameters for someone investing in both the indices. The Mixed Index takes into account end-of-year rebalancing whenever the allocation between the two indices deviates by more than +/- 5%.
This option can fetch you relatively better returns (compared to the Nifty 50) along with relatively lower volatility (compared to the Nifty Next 50). This is hardly surprising given that it’s a mix of the two indices!
Higher returns
In terms of returns, the Mixed Index has given a 3-year return (annualised) of 15% plus, 42% of the time, higher than that for an investment made only in the Nifty 50 but lower than that made in the Nifty Next 50 alone. The conclusions remain broadly unchanged for the 5 and 7-year periods too. See the table below.
Lower volatility
On the volatility front, the Mixed option has fared better than the Nifty Next 50.
- The Mixed Index has a lower downside capture ratio of 104% compared to 109% for the Nifty Next 50.
- It also comes with maximum drawdowns that are a tad less sharp.
- Its intra-year volatility too has been lower than that of the Nifty Next 50 in 16 out of 25 years.
- The 6-month return ranges too are narrower for the Mixed option.
See the charts and tables below:

The 50-50 allocation between the Nifty 50 and the Nifty Next 50 is therefore, a suitable option for those who are comfortable with some volatility for relatively better returns.
Is Nifty 100, Nifty 50 plus Nifty Next 50?
There’s one more point worth mentioning. Some of you may consider investing in the Nifty 100 instead of doing a 50-50 allocation between the Nifty 50 and Nifty Next 50.
After all isn’t the Nifty 100 simply the totality of Nifty 50 plus the Nifty Next 50?
Not quite. The list of the Nifty 50 and the Nifty Next 50 companies put together does exactly match with the list of the Nifty 100 companies. But, the weight of each company in the Nifty 50 (or the Nifty Next 50) is not the same as its weight in the Nifty 100.
The Nifty 50 companies taken together have a weight of almost 86% in the Nifty 100. The Nifty Next 50 companies account for only the remaining 14%. That is, the Nifty 100 overwhelmingly represents the Nifty 50 and its returns too are, therefore going to closely match those of the Nifty 50.
By investing in the Nifty 100, you are by and large investing in the Nifty 50 and not in a 50-50 mix of the Nifty 50 and the Nifty Next 50.
What it means for investors
From a short-term perspective (next 1-3 years), as the polarisation in large caps comes to an end, large cap funds can witness another phase of outperformance. A likely mean reversion in the recent underperformance of midcap stocks (account for up to 20% of large cap fund portfolio) too should funds perform better.
So existing investors in large cap active funds can continue to remain invested.
From a longer-term (beyond 3 years) perspective, we would like to gradually shift our preference to index funds over active funds for investment in the large cap space.
- Ultra-conservative investors can opt for a Nifty 50 index fund.
- Those with a higher risk appetite can go for a Nifty Next 50 index fund.
- Those who want higher returns than the Nifty 50 but also want to play it a bit safe, can consider dividing their large cap allocation 50-50 between the Nifty 50 and Nifty Next 50.
With respect to other diversified categories such as multicaps, mid and small cap segments, our view remains that well-managed active funds will continue to outperform their passive peers.


 Wealth Conversations – April 2024
- Temporary suspension of subscriptions in ” Mirae Asset Global Electric & Autonomous Vehicles ETFs Fund of Fund & Mirae Asset Global X Artificial Intelligence & Technology ETF Fund of Fund
- Merger Announcement: Aditya Birla Sun Life CRISIL IBX AAA Mar 2024 Index Fund
 Here is everything that you need to know about Arbitrage Funds
- Temporary suspension of subscriptions in “DSP US Treasury Fund of Fund”